

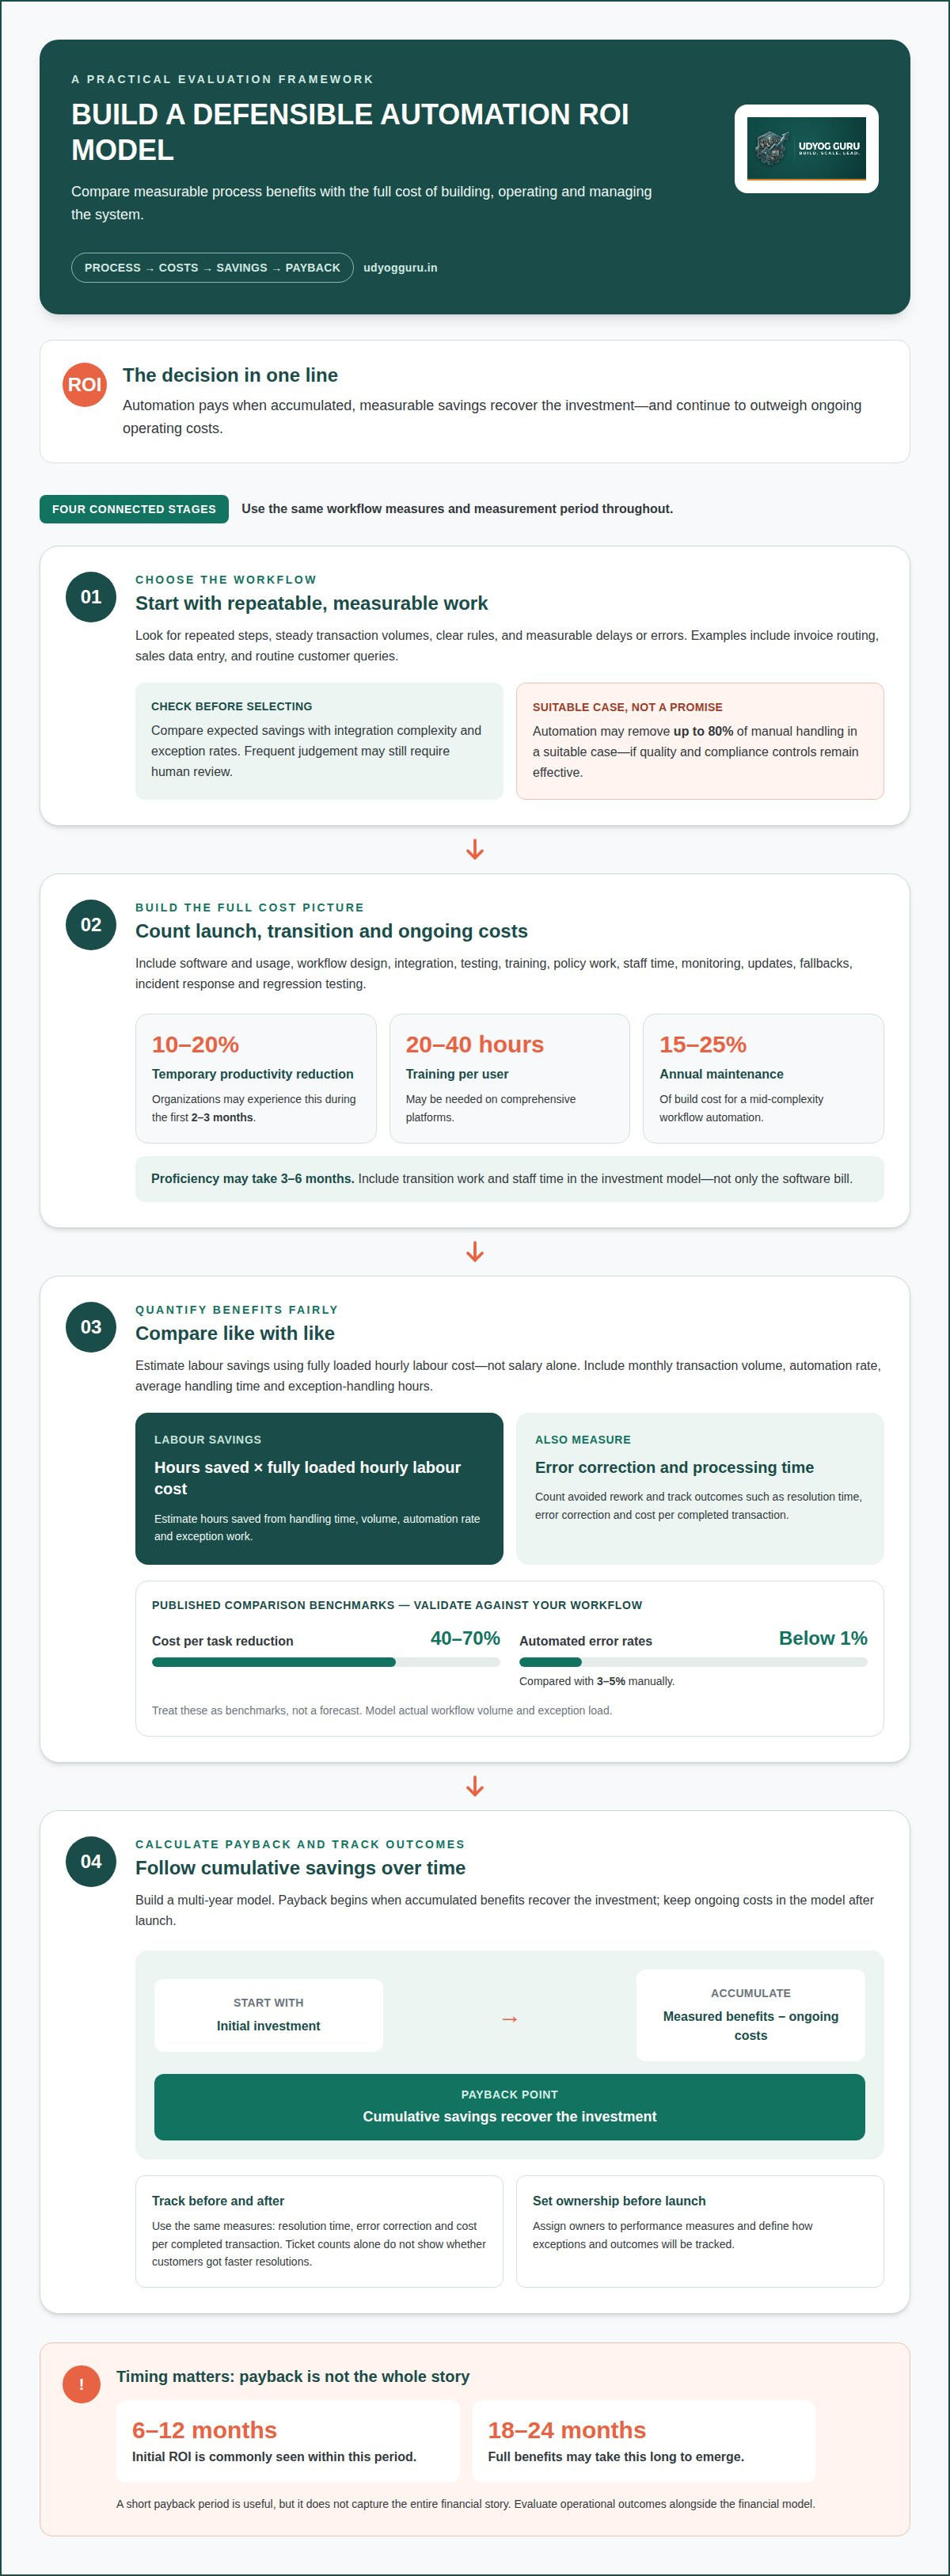
Most organizations see initial ROI from process automation within 6-12 months, while the full benefits may take 18-24 months to emerge. The ROI of business process automation depends on whether savings in labour, errors and processing time outweigh implementation and ongoing operating costs. A short payback period is useful, but it doesn’t tell the whole financial story.
It’s reasonable to want a clear forecast before changing a workflow: automation should reduce a measurable operating cost, not simply move work into a new system. This article explains how to assess business impact, calculate total costs and savings, and estimate payback using the factors that shape the result. It also considers ROI statistics and why reported figures vary by process, scale, and measurement period. The goal is a practical framework for evaluating automation in an Indian business, with costs and savings considered in rupees and assumptions made clear.
Key Takeaways
- Assess automation by comparing measurable process benefits with the full cost of building, operating and managing the system.
- Include labour, error correction and processing time in savings estimates, using fully loaded labour costs rather than salary alone.
- Estimate payback against workflow volume, exception handling and integration effort, then track operational outcomes such as resolution time.
- Use ROI statistics as benchmarks, not forecasts; Udyog Guru’s Business X-Ray™ and AI Tech Business Integration Bootcamp can help assess processes and technology integration.
Automation ROI: What’s the Impact on Your Business?
Automation returns depend on workflow volume, avoided errors, employee time freed up, and the full cost of operating the software. A sound analysis compares measurable savings with total ownership costs, not just implementation effort.
Automation Costs and Returns
Automation ROI compares the value a workflow creates with its purchase, implementation, and management costs. This matters because a low initial software cost can conceal integration, oversight, and exception-handling expenses.
For processes involving Indian customers or operations, assess privacy, access controls, record retention, and sector-specific compliance risks before automating sensitive information. Set controls for who can access data, how decisions are recorded, and when staff review exceptions.
RPA and Intelligent Automation Returns
Robotic process automation (RPA) handles structured, repeatable software actions; intelligent process automation adds tools that interpret documents or classify requests. The distinction matters: RPA may suit stable data entry, while invoice extraction may require validation and human review.
Published ROI examples span financial services, healthcare, manufacturing, and government. They offer useful process comparisons for Indian businesses, but international results should not be presented as India-specific case studies.
Tracking Returns with Analytics
Analytics connect automation activity to operational outcomes such as resolution time, error correction, and cost per completed transaction. Track the same measures before and after deployment. Ticket counts alone cannot show whether customers received faster resolutions.
In India, assessment and implementation typically involve mapping the workflow, identifying data and control risks, choosing a suitable process, piloting software, and tracking exceptions and outcomes. Assign owners to performance measures before launch.
Selecting High-Return Processes
Strong candidates for automation have repeated steps, steady transaction volumes, clear rules, and measurable delays or errors. Invoice routing, sales data entry, and routine customer queries are examples. Processes that require frequent judgement may still need human review.
Prioritise by comparing expected savings with integration complexity and exception rates. A workflow where automation removes substantial manual handling, potentially up to 80% in a suitable case, may justify analysis, but only if quality and compliance controls remain effective.
Calculating implementation costs, savings and payback
Build a multi-year model that includes implementation, ongoing operations, and measurable savings. Payback begins when accumulated benefits recover the investment.
In India, automation costs depend on workflow complexity, system integration, data requirements, and ongoing support. Estimate the project using these factors rather than relying on a generic cost range.
Technology, Training, and Change Costs
Technology, training and change costs cover the tools, staff preparation and transition work needed to put automation into operation. Including them matters because deployment can temporarily affect output: organizations may experience a 10-20% productivity reduction during the first 2-3 months. Users may need 20-40 hours of training per user on comprehensive platforms, and 3-6 months to reach full proficiency. Include change management, policy work and staff time in the investment model.
Build and Maintenance Costs
Build costs cover designing and testing the workflow, connecting systems and preparing its knowledge sources; maintenance covers ongoing operation. Both matter because software purchase costs alone understate total ownership cost. Include workflow design, integration, testing, policy and analytics during implementation. Then budget for usage, monitoring, updates, fallbacks, incident response and regression testing. Annual maintenance for a mid-complexity workflow automation typically costs 15-25% of its build cost.
Implementation Costs and Operational Savings
Implementation costs are the upfront resources needed to launch a workflow. Operational savings accrue through reduced handling effort and fewer corrections. Compare like with like: use fully loaded hourly labour costs, monthly transaction volume, automation rate, and exception-handling hours. Track benefits across multiple years, because costs continue after launch. A payback calculation should show when cumulative savings offset the initial investment, not just the first software bill.
Manual and Automated Process Costs
Manual process costs include staff time, handoffs and error resolution; automated costs add software, integration and maintenance. This comparison matters because high integration effort or recurring exceptions can delay payback. A manual-versus-automated analysis reports cost per task reductions of 40-70%, with automated error rates below 1% versus 3-5% manually. Treat these as benchmarks, then model the workflow’s actual volume and exception load. A Business X-Ray™ process assessment can help map workflow costs before investment decisions.
Example calculation of automation savings and ROI
A practical example separates labour savings, productivity gains, and avoided rework before combining them. Use the same measurement period for each benefit and for automation costs.
Labor Savings and Error Reduction Formulas
Labour savings estimate the value of effort removed, while error reduction measures the cost of corrections avoided. Together, they show whether a workflow’s financial return goes beyond faster processing.
Labour savings = hours saved × fully loaded hourly labour cost. Estimate hours saved using average handling time, monthly volume, automation rate, and exception-handling hours. Error reduction savings = errors avoided × average cost to resolve each error. Calculate errors avoided by comparing error counts before and after automation across equivalent transaction volumes.
Labor Savings and Productivity Gains
Consider two employees spending 10 hours per week on a recurring task. If automation reduces effort by 80%, calculate the hours released, then multiply them by the fully loaded labour cost and 52 weeks.
This example measures capacity, not automatic payroll reduction. The organization gains financial value when employees use released time for productive work, or when the business avoids additional labour. Business process automation can improve productivity by up to 30%, but process-level measurement shows whether that gain appears in a specific workflow.
Error Reduction and Rework Savings
Rework savings quantify the correction effort eliminated when validation reduces errors. For example, processing 500 invoices monthly at a 3% error rate produces 15 errors per month. Multiply the errors avoided after automation by the average resolution time and fully loaded hourly cost.
Track error frequency and correction effort separately; fewer errors do not always mean fewer hours if complex exceptions remain. Manufacturing automation often reduces processing costs by 30-50%, and reported manufacturing automation ROI often exceeds 300%. Use those figures as sector benchmarks, then calculate the local result using observed production volume, error rates and implementation costs.
For a simple return calculation, divide measured benefits by costs and multiply by 100%. A benefit-to-cost ratio of 3.16 therefore expresses as 316%; state the period and included costs alongside the result.
Business process automation ROI statistics
The ROI of business process automation varies by industry, workflow volume, and measurement period. Treat published figures as benchmarks, then check whether their process, cost base, and deployment scale resemble your own.
How to read reported returns
One Symtrax-cited study reports an average 240% return from automation. Other reported estimates place project returns between 40% and 300% within the first 12-18 months. These figures use different scopes and timelines, so they are not interchangeable. A first-year return, a three-year return and a payback period describe distinct outcomes.
Sector estimates show the same variation. Financial services automation is reported at 200-400% over three years, compared with 150-300% for healthcare and 150-250% for government. These ranges indicate that workflow design and operating context matter. They do not establish a guaranteed outcome for an Indian organization in any of these sectors.
Workflow-level figures can help narrow analysis. Invoice and accounts-payable automation has a stated first-year ROI range of 80-220%; client onboarding ranges from 60-180%. Internal reporting and dashboards are reported at 50-130% for businesses with $500K-$10M in revenue. Those revenue bands are not rupee equivalents, so apply the process insight rather than treating the figures as India-market forecasts.
Payback data adds another lens: reported estimates put initial returns at 6-12 months for most organizations, while customer service and document-processing automation often pay back within 3-6 months. High-volume workflows can produce savings sooner, but integration effort, exception rates and measurement choices shape the timeline. Compare initiatives over matching periods and include operating costs.
For an Indian business, use published statistics to identify promising processes, then build a separate model from local transaction volume, labour costs and system requirements. A grounded ROI of business process automation assessment turns benchmarks into a process-specific decision. Assess your automation priorities through a structured review of workflows and expected returns.
Udyog Guru
Udyog Guru helps business owners examine operational systems and identify where process improvement and technology integration fit. When automation decisions depend on unclear workflows, roles or costs, Business X-Ray™ (Tier 1) and Business Acceleration Engine™ (Tier 2) provide structured transformation frameworks. Workforce X-Ray™ focuses on workforce optimisation, while the AI Tech Business Integration Bootcamp (Tier 3) focuses on embedding AI and modern technology into existing workflows.
This is a useful next step when you need to connect automation opportunities with business operations, workforce capacity, and technology adoption, rather than assess software in isolation. The right approach depends on the operational challenge you need to address. Contact Udyog Guru to discuss your business process automation priorities.
Turn the ROI assessment into an operating decision
Next, connect automation priorities to the people and processes that will make them work. A workflow can produce a favourable financial model yet stall if ownership, delegation, or technology adoption remains unresolved. Treat the ROI of business process automation as an operating decision: align the process, team responsibilities, and implementation approach before committing resources.
Udyog Guru’s Business X-Ray™ (Tier 1) and Business Acceleration Engine™ (Tier 2) support structured business transformation, while Workforce X-Ray™ focuses on workforce optimisation. These offerings can help bring process and people considerations into the same assessment, so automation planning reflects how work actually moves through the organisation.
Use the next discussion to identify the operational constraint you want to address and the outcome that would make change worthwhile. Contact Udyog Guru to discuss automation and define a practical direction for your business. A clear starting point helps turn analysis into deliberate progress.
Frequently Asked Questions
How do you choose which process to automate first?
Start with a process that has a clear business owner and a visible operational problem. For example, if sales staff repeatedly re-enter order details, map where errors occur and what downstream work they trigger. Confirm that the steps follow stable rules and that exceptions can be routed for review. A bounded workflow with accessible records is easier to assess than an end-to-end process spanning several teams.
Does automation ROI require laying off employees to realize?
No. Savings can come from reallocating employee time to customer support, sales follow-up, or quality checks rather than reducing headcount. For example, staff freed from repetitive data entry could handle unresolved customer cases. The financial benefit depends on whether the organization converts that capacity into useful output, avoids additional hiring, or reduces overtime. Track the new work completed alongside the automated task’s performance.
How can I calculate ROI for my own processes?
Use your own operational records instead of a broad industry benchmark. Compare the current workflow’s labour, rework, and delay costs with the proposed system’s implementation and ongoing expenses. Keep transaction volumes and measurement periods consistent. For example, separate routine transactions from exceptions, then include the staff time needed to review those exceptions. This makes the estimate more representative of actual operating conditions.
How can organizations ensure automation continues to deliver ROI over time?
Assign an owner to review whether the workflow still matches current business rules and operating conditions. Changes to forms, approval routes, or source systems can cause failures that reduce automation’s value. Monitor completed transactions, exception handling, and manual workarounds together. When a metric shifts, trace it to a process change, data issue, or control gap, then update the workflow and its measurement baseline.
How do I get a credible ROI estimate for my specific business?
Build the estimate from process evidence: transaction records, staff effort, correction work, exception patterns, and system dependencies. Document assumptions separately, especially expected automation coverage and human review needs. Then compare a conservative operating case with the expected case, using the same cost categories and period. A credible estimate explains what could change the result instead of presenting a return figure without its underlying conditions.
What ROI Can Be Expected from Automating Sales Data Entry?
There is no single expected return for every sales data entry workflow. Results depend on record volume, how much information can be captured reliably, error correction effort, and the systems involved. Assess a defined record type first, such as incoming sales orders, and measure whether automation reduces re-entry and correction work. Include exception review and ongoing system costs before judging the financial result.


