

If your scaling strategy relies on a spreadsheet that was last updated forty-eight hours ago, you aren't managing an enterprise; you're performing surgery in the dark. For many Indian SMEs, the transition from local success to national scale is often sabotaged by a lack of real-time diagnostic clarity. You likely feel the weight of this systemic failure through the constant anxiety of manual financial monitoring and the persistent fear of a liquidity collapse during aggressive expansion.
It's a common reality that as complexity increases, the manual tools that served you at the start become dangerous liabilities. This article will show you how to architect a professional cash flow tracking dashboard that functions as a systematic financial command center. We'll examine the installation of automated reporting engines that eliminate founder dependency. You'll learn to replace delayed accounting data with a real-time diagnostic scan, ensuring your business remains a well-calibrated machine capable of predictable growth and structural integrity.
Key Takeaways
- Replace historical accounting autopsies with real-time vital sign monitoring to ensure immediate operational calibration.
- Categorize financial metrics into current health and future trajectory layers to maintain structural integrity during periods of rapid expansion.
- Implement a professional cash flow tracking dashboard via automated data pipelines to eliminate manual extraction errors and reduce owner dependency.
- Execute a structured five-step installation protocol that replaces fragile spreadsheets with a durable financial command center.
- Align your financial monitoring with the Business Acceleration Engine™ to transition from reactive firefighting to the strategic engineering of your enterprise.
Beyond the Ledger: Why a Cash Flow Tracking Dashboard is a Diagnostic Necessity
Managing a scaling enterprise using only a monthly P&L is like attempting to navigate a high-speed aircraft by looking at a photograph of the ground taken last week. A standard cash flow statement provides a necessary historical record, but it functions primarily as a financial autopsy. It tells you why the business succeeded or failed in the past. In contrast, a cash flow tracking dashboard serves as a real-time diagnostic scan of organizational liquidity. It transforms static data into a live stream of vital signs, allowing for the immediate detection of operational bottlenecks before they manifest as critical failures.
Scaling requirements in 2026 demand a level of precision that traditional accounting cycles can't provide. As global markets accelerate and AI-driven competition tightens margins, the latency between a transaction and its reporting must be minimized. Real-time visibility isn't a luxury; it's a structural requirement for any entity aiming for predictable growth. Without this clarity, leadership is forced to make high-stakes decisions based on intuition rather than verified architecture.
The Failure of Traditional Spreadsheet Reporting
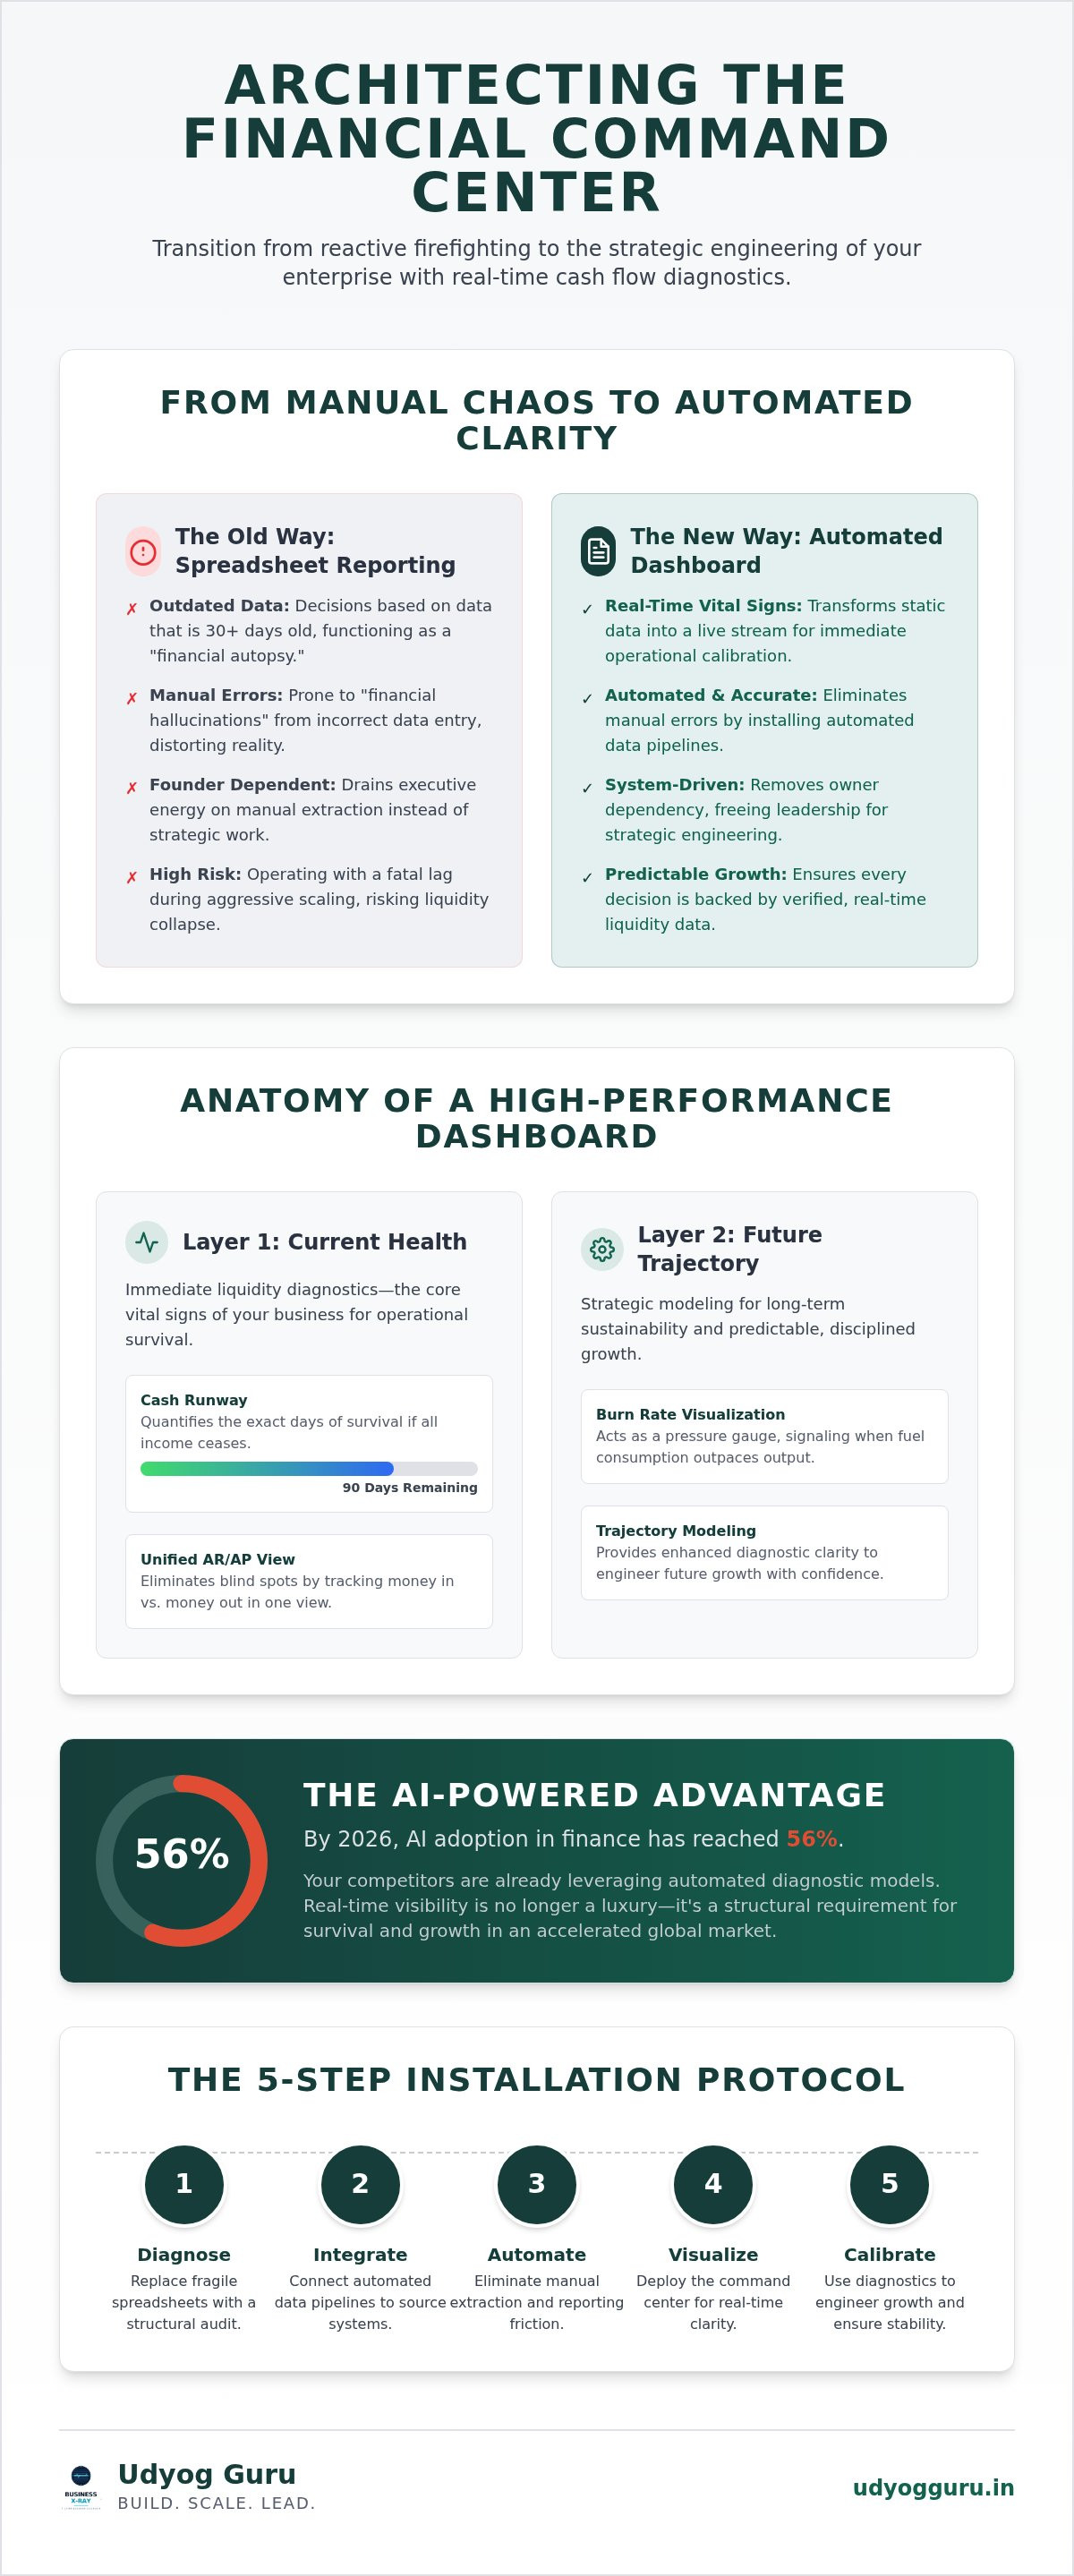
Most founders rely on fragmented Excel files that lack structural integrity. These systems are prone to "financial hallucinations," where manual data entry errors create a distorted view of reality. When decisions are made based on data that's 30 days old, the business is operating on a lag that can be fatal during aggressive scaling. Manual extraction is a high-friction process that drains executive energy and introduces unnecessary risk into the machine. You can't calibrate an engine while it's running if your gauges are broken.
Establishing the Financial Command Center
The transition from a business owner to a systems architect begins with the installation of a central hub for fiscal control. By installing a robust cash flow tracking dashboard, you replace intuition with engineering. This command center integrates directly with the Business Acceleration Engine™, ensuring that every operational move is backed by verified liquidity data. By centralizing your financial monitoring, you remove the guesswork from the equation.
- Elimination of owner dependency for routine financial checks.
- Systematic calibration of spending against real-time revenue.
- Enhanced diagnostic clarity for future trajectory modeling.
This shift allows the leadership team to focus on strategic engineering rather than tactical firefighting. It installs a sense of order that's essential for maintaining stability while the enterprise grows in complexity. When the financial architecture is sound, the focus shifts from survival to optimization.
The Anatomy of a High-Performance Financial Command Center
A high-performance cash flow tracking dashboard isn't a decorative display; it's a structural blueprint that maps the enterprise circulatory system. To achieve operational clarity, you must categorize data into two distinct layers: Current Health and Future Trajectory. This differentiation allows a systems architect to distinguish between immediate survival and long-term sustainability. By integrating Accounts Receivable (AR) and Accounts Payable (AP) into a single, unified view, you eliminate the blind spots that often lead to scaling accidents. Research indicates that AI adoption in finance has reached 56% in 2026, which means your competitors are likely already moving toward these automated diagnostic models.
Visualizing the Burn Rate is essential for any scaling engine. It represents the enterprise's fuel consumption. If the engine's output isn't outpacing its intake, the dashboard acts as a pressure gauge, signaling the need for immediate calibration. This level of transparency is what transforms a chaotic startup into a disciplined enterprise. It ensures that every rupee allocated to growth is backed by verified liquidity rather than optimistic projections.
Tier 1 Metrics: Immediate Liquidity Diagnostics
These metrics represent the core vital signs of the business. Without these, you're operating in a state of clinical blindness. They provide the foundational data needed for the Financial Command Dashboard to function as a true command center.
- Cash Runway: This quantifies the exact days of survival remaining if all inflows were to cease immediately. It's the ultimate measure of enterprise resilience.
- Net Cash Flow: The delta between operational inflows and outflows, revealing if the machine is self-sustaining or leaking capital through inefficient channels.
- Opening vs. Closing Balance: Measuring the daily pulse of liquidity to detect micro-fluctuations that could indicate systemic stress or unexpected operational friction.
Tier 2 Metrics: Efficiency and Velocity
Once the vital signs are stable, you must analyze the engine's efficiency. These metrics focus on the velocity of capital through the system and the structural integrity of your financial relationships.
- Days Sales Outstanding (DSO): This analyzes the speed of revenue conversion. A high DSO indicates a blockage in the acquisition funnel's terminal phase, requiring a diagnostic check on collection protocols.
- Accounts Payable Turnover: Measuring the health of supplier relationships ensures your supply chain remains lubricated and reliable, preventing sudden halts in production.
- Profitability Ratios: These distinguish between mere cash movement and actual profit. It's vital to remember that cash flow doesn't always equal profitability, and a failure to see the difference can lead to structural collapse during rapid expansion.
Architecting Real-Time Visibility: Automation Protocols and AI Integration
Real-time visibility is the byproduct of a well-engineered data pipeline. To eliminate the diagnostic lag discussed in previous sections, you must install automated protocols that bridge the gap between your accounting software and your executive display. A cash flow tracking dashboard reaches its peak utility when it functions autonomously, stripping away the friction of manual data entry and the potential for human bias. Transitioning from manual extraction to automated data streams ensures that the financial information you're analyzing is both current and clinically accurate.
With the global cash management system market projected to reach $22.4 billion in 2026, the infrastructure for automated monitoring is more accessible than ever. However, the value isn't in the software alone; it's in the systematic calibration of these tools to match your enterprise's unique operational architecture. By removing human intervention from the reporting cycle, you protect the structural integrity of your financial diagnostics.
Automated Data Extraction Protocols
The installation of a financial command center requires seamless integration with existing ERP systems, such as Tally or QuickBooks. By establishing "Trigger-Action" protocols, the system can generate instant financial alerts when liquidity thresholds are breached. This setup ensures that your visualization engine is constantly fed with fresh data, allowing for immediate identification of cash flow anomalies. When the reporting cycle is automated, the time previously spent on data collection is redirected toward strategic engineering and systematic repair.
AI-Driven Cash Flow Forecasting
Modern scaling enterprises must leverage predictive algorithms to model complex "What-If" scenarios. Following the principles taught in the AI Tech Business Integration Bootcamp, leadership teams can move beyond descriptive analytics into the realm of prescriptive engineering. With the global AI in accounting market valued at $10.87 billion in 2026, the use of agentic AI to detect anomalies is no longer an experimental luxury. These systems autonomously scan for patterns that suggest impending payment delays or identify operational gaps in the workforce before they impact the burn rate. This predictive capability allows for proactive calibration of the Business Acceleration Engine™, ensuring the machine remains stable even during aggressive growth phases.
Data hygiene is the invisible foundation of this entire architecture. If the underlying software systems are fragmented or poorly maintained, the AI's diagnostic output will be compromised. Maintaining a clean, integrated data environment is the primary duty of the systems architect, as it ensures the cash flow tracking dashboard provides a reliable reflection of reality. Without rigorous data governance, even the most advanced AI protocols will fail to deliver the predictable growth your enterprise requires.
The Installation Protocol: Moving from Spreadsheets to Systematic Dashboards
The transition from fragile, manual spreadsheets to a robust financial command center is an engineering feat, not a mere software update. It requires a clinical approach to organizational rewiring, ensuring that every data point is verified and every user role is strictly defined. By following a structured installation protocol, you establish a Single Version of Truth (SVOT) that eliminates conflicting reports and management by intuition. This systematic calibration ensures that your cash flow tracking dashboard remains a reliable diagnostic tool as your enterprise scales into more complex territory.
Step 1: Diagnostic Assessment and Mapping
Before installation, a thorough diagnostic scan is mandatory. This phase utilizes the Business X-Ray™ framework to identify current data silos and operational bottlenecks that currently lead to financial hallucinations. You must map the flow of capital through every department, establishing baseline KPIs that will serve as the foundation for your real-time monitoring. Mapping the circulatory system of your business allows for the identification of where liquidity is trapped, ensuring the eventual dashboard displays the most critical pressure points.
Step 2: Architecture and Tool Selection
Selecting the right visualization engine is a matter of structural integrity. For national Indian SMEs, the platform must support deep integration with common ERPs like Tally to ensure data hygiene. The architecture should facilitate a tiered hierarchy of information; while a CEO requires high-level trajectory data, an Operations Manager needs granular liquidity diagnostics. This tiered access ensures that the system architecture supports future scaling without requiring a complete overhaul of the financial command center every time the workforce expands.
Step 3: Systematic Implementation and Calibration
The final phase involves the physical installation of the cash flow tracking dashboard. During this period, you must run parallel reports against your legacy systems to verify the dashboard's accuracy and ensure no data is lost in transit. Training the workforce on these new reporting protocols is essential to ensure team accountability and data consistency. Once calibrated, the dashboard becomes the primary decision tool, replacing the fragmented Excel files that previously hindered your growth. Defining access permissions during this stage prevents data corruption and maintains a clean audit trail. To begin your organizational transformation and secure your liquidity, you can install the Financial Command Dashboard through our structured framework.
The Financial Command Dashboard: Achieving Operational Clarity with Udyog Guru
The Financial Command Dashboard functions as the terminal interface for the Business Acceleration Engine™, providing the structural feedback necessary to maintain high-velocity growth without risking mechanical failure. By installing this system, you transition from a reactive firefighter to a Systems Architect who views business challenges as solvable puzzles of logic. Udyog Guru provides the rigorous auditing required to ensure your cash flow tracking dashboard is fed by clean, uncorrupted data pipelines, allowing for the precise calibration of your scaling strategy.
Achieving the "15-Minute CEO Dashboard" state isn't a matter of simplification; it's a matter of sophisticated filtration. This state represents the peak of operational maturity, where the founder can perform a comprehensive diagnostic scan of the entire enterprise machine in a single quarter-hour session. It replaces the frantic energy of manual monitoring with the calm confidence of data-driven control, ensuring that every strategic move is backed by verified liquidity.
Removing Founder Dependency Through Data
Founder burnout is often a symptom of a poorly architected delegation system. When financial data is trapped in the founder's head or fragmented spreadsheets, every decision requires their direct intervention. Installing a professional cash flow tracking dashboard installs a new protocol for accountability. By providing the team with access to real-time fiscal data, you empower them to make calibrated decisions without constant executive oversight. This systematic clarity reduces the cognitive load on the founder, allowing them to shift their focus from daily survival to long-term structural integrity.
- Automated reporting cycles that eliminate the need for manual check-ins.
- Defined access permissions that ensure data hygiene and team accountability.
- Real-time visibility that allows managers to self-correct operational gaps.
Next Steps: The AI Tech Business Integration Bootcamp
Once the foundational financial systems are stable, the next phase of enterprise evolution involves high-level technology integration. Scaling your financial systems alongside your workforce requires a sophisticated understanding of automated workflows. The AI Tech Business Integration Bootcamp provides the advanced framework needed for high-output enterprises to maintain their competitive edge in the 2026 market. This program ensures that your Business Acceleration Engine™ is fully optimized for national scale, leveraging the latest in agentic AI to maintain structural stability. To begin this transformation and secure your enterprise's future trajectory, Install Your Financial Command Dashboard Today.
Architecting Your Enterprise Trajectory
The transition from manual spreadsheet monitoring to a systematic financial command center is the defining characteristic of a mature, scaling enterprise. By installing a robust cash flow tracking dashboard, you move beyond the era of financial hallucinations and into a state of absolute diagnostic clarity. This transformation requires more than just a software update; it demands the rigorous application of the Business X-Ray™ diagnostic framework to identify and repair systemic leaks within your capital flow before they compromise your liquidity.
Your enterprise's stability depends entirely on the structural integrity of its financial engine. Leveraging our AI Tech Integration Expertise, you can architect automated data pipelines that feed directly into the proprietary Business Acceleration Engine™, ensuring your growth remains predictable and your decision-making remains data-driven. It's time to replace the frantic energy of reactive management with the calm confidence of a systems architect who understands their machine's vital signs. You've the blueprint for a high-performance command center. Now, you must proceed with the installation to secure your enterprise's trajectory.
Secure Your Financial Command Dashboard with Udyog Guru to install the diagnostic precision your scaling business deserves.
Frequently Asked Questions
What is the primary difference between a cash flow dashboard and a P&L statement?
A Profit and Loss statement records revenue and expenses on an accrual basis, often providing a historical autopsy of performance. Conversely, a cash flow tracking dashboard monitors the actual movement of liquid capital in real-time. While a P&L might show profitability, it won't reveal if you've the liquidity to meet payroll tomorrow. The dashboard functions as a live diagnostic scan, ensuring the engine remains lubricated regardless of what the accounting books report.
Can a cash flow tracking dashboard integrate with Tally for Indian businesses?
Seamless integration with Tally is a fundamental requirement for any cash flow tracking dashboard operating within the Indian SME ecosystem. The system architecture must facilitate automated data pipelines from Tally to ensure diagnostic precision. This connection eliminates manual extraction errors and provides a Single Version of Truth. By 2026, these automated integrations have become the standard for enterprises seeking to maintain structural integrity while scaling across national markets.
How often should a business owner review their financial command dashboard?
You should perform a high-level diagnostic scan of your Financial Command Dashboard daily to monitor the liquidity pulse. This ensures micro-fluctuations don't escalate into systemic failures. A more comprehensive trajectory calibration should occur weekly. During these sessions, the leadership team analyzes the delta between projected and actual cash movement. This methodical rhythm allows for precise adjustments to the Business Acceleration Engine™ without requiring the founder's constant tactical intervention.
Is AI integration necessary for an effective cash flow dashboard in 2026?
AI integration has become a diagnostic necessity for effective financial monitoring in 2026. Predictive algorithms autonomously scan for anomalies that human analysts might overlook, such as subtle shifts in payment velocity. These systems model complex "What-If" scenarios, allowing you to anticipate liquidity gaps before they impact your burn rate. Without AI-driven insights, your dashboard remains a descriptive record rather than the proactive engineering tool required for high-velocity enterprise scaling.
How does a dashboard help in reducing founder burnout?
Burnout is frequently a symptom of cognitive overload caused by manual financial monitoring and the anxiety of data latency. A systematic dashboard removes this burden by installing a reliable, automated reporting engine. When you've real-time visibility, you can delegate decision-making authority to your team with confidence. This transition from business owner to systems architect allows you to focus on strategic engineering rather than performing daily tactical autopsies on fragmented spreadsheets.
What are the most critical KPIs to track for a scaling SME?
A scaling SME must prioritize metrics that quantify both current health and future trajectory. The most critical KPIs include:
- Cash Runway: The exact duration the enterprise can survive at its current burn rate.
- Days Sales Outstanding (DSO): The velocity of revenue conversion.
- Net Cash Flow: The operational delta between inflows and outflows.
Do I need custom software development to build a cash flow dashboard?
You don't need custom software development to architect an effective financial monitoring system. Professional frameworks, such as the Financial Command Dashboard, are designed to integrate with existing ERPs via standardized protocols. Relying on custom-built solutions often introduces unnecessary complexity and maintenance friction. Instead, focus on installing a proven visualization engine that's already been calibrated for the specific diagnostic requirements of a scaling enterprise machine.
How long does the installation protocol typically take for a mid-sized business?
The installation protocol typically follows a structured five-step path that can be completed within a few weeks for most mid-sized enterprises. This timeline includes the initial Business X-Ray™ diagnostic scan, tool selection, and systematic calibration. The duration depends on the complexity of your current data silos and the speed at which your workforce adopts new reporting protocols. A methodical implementation ensures the final architecture is durable and ready for national scale.


