

Your business is not a creative outlet; it's a complex mechanical system that is currently stalling because you are the only component keeping the engine running. Most founders mistakenly believe their personal involvement is the primary driver of value, yet this dependency is the very pathology that creates operational bottlenecks and prevents true scaling. You've likely reached a ceiling where team performance lacks transparency and every growth attempt results in further chaos.
It's time to stop treating your operations with temporary fixes and start applying rigorous engineering principles. By utilizing professional business process mapping services, you can move beyond the "hustle" and begin the clinical architecture of a scalable enterprise. This guide provides the protocols to transform your current workflows into a high-performance machine that functions independently of your daily input. We'll show you how to move from a founder-dependent model to a structured environment of automated delegation.
We will explore the diagnostic phase of a Business X-Ray™, the implementation of a Business Acceleration Engine™, and how these structural changes lead to predictable growth. With the Asia Pacific region projected to see the highest growth in the global BPM market through 2033, the installation of these protocols is no longer optional for firms looking to remain competitive. You'll learn how to replace friction with a streamlined system designed for the modern Indian enterprise.
Key Takeaways
- Conduct a clinical Business X-Ray™ to diagnose the structural bottlenecks currently creating operational chaos and founder dependency.
- Utilize expert business process mapping services to create the architectural blueprint necessary for installing a scalable Business Acceleration Engine™.
- Differentiate between SIPOC and Value Stream Mapping protocols to target specific inefficiencies in your acquisition and fulfillment systems.
- Implement a rigorous 5-step data extraction protocol to capture enterprise DNA from subject matter experts without personal bias.
- Evolve from manual workflows to automated systems by integrating AI Tech Business protocols into your final operational architecture.
From Operational Chaos to Clinical Clarity: The Role of Mapping Services
Operational success is not a result of founder intuition or sporadic effort. It's the output of a precisely calibrated machine. For many Indian enterprises, the science of Business process mapping serves as the clinical documentation of their enterprise DNA. While traditional flowcharting often settles for superficial diagrams that describe ideal scenarios, professional business process mapping services focus on the rigorous diagnosis of actual workflows. This represents the diagnostic scan phase of a Business X-Ray™, identifying the hidden pathologies that cause system failure before any structural repair begins.
The Symptoms of a Broken Process Architecture
The most common pathology found in scaling businesses is founder dependency. If your presence is the only factor preventing a total operational collapse, you aren't a CEO; you're a single point of failure. This dependency creates a bottleneck that limits growth to the founder's personal bandwidth. Firefighting becomes the primary mode of operation. This constant reactive state carries a heavy financial burden. In the Indian market, where competition is aggressive, the cost of these inefficiencies often manifests as stagnant revenue growth and high staff turnover. Without a clear map, your team operates in a vacuum of transparency. This leads to performance gaps that remain invisible until a crisis occurs.
The ROI of Systematic Process Documentation
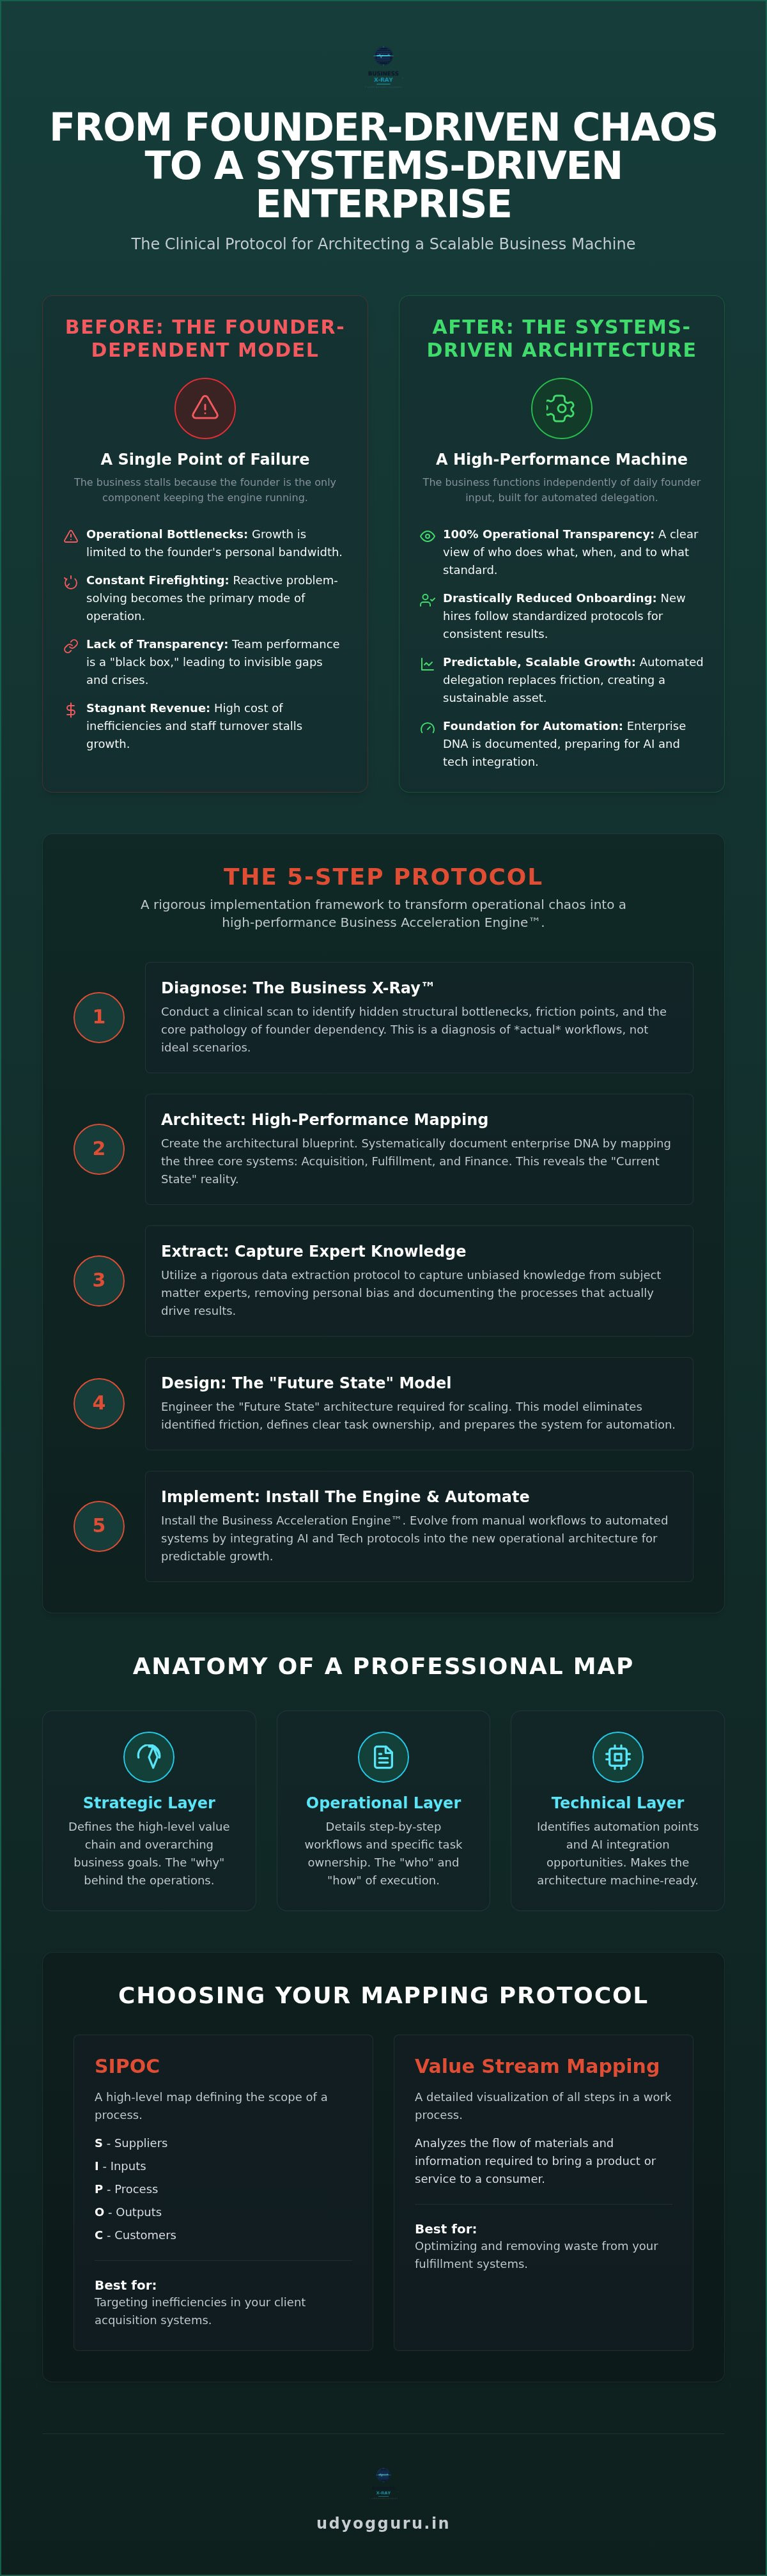
Transitioning from manual, founder-led chaos to a systems-driven architecture provides immediate structural integrity. Systematic documentation delivers 100% transparency into every functional layer of the organization. You gain a clear view of who executes a task, when it occurs, and what the specific output must be. This clarity drastically reduces employee onboarding time. Instead of relying on tribal knowledge, new hires follow standardized protocols that ensure consistent results. This documentation is the essential prerequisite for installing a Business Acceleration Engine™. By identifying high-friction areas during the mapping phase, you prepare the enterprise for automated delegation and predictable scaling. This methodical approach transforms your business from a volatile project into a sustainable, high-performance asset.
The Anatomy of High-Performance Business Process Mapping
High-performance mapping treats the enterprise as a biological entity with distinct, interconnected organ systems. Professional Process mapping identifies three primary functional systems: Acquisition (lead generation and conversion), Fulfillment (product or service delivery), and Finance (cash flow and capital allocation). By categorizing workflows into these specific systems, business process mapping services move beyond simple task lists to create a comprehensive operational architecture. This approach allows for a precise "Current State" diagnostic map, which reveals the existing friction before designing the "Future State" model required for scaling.
Within these maps, we identify "Decision Nodes." These are the critical junctions where a process either advances toward a goal or fails due to a lack of clarity. Integrating a Financial Command Dashboard into this flow ensures that every operational step is tied to a measurable financial outcome. This allows founders to see the direct impact of process efficiency on the bottom line. If you're ready to move from chaos to order, you might start by auditing your current systems to identify these high-stakes nodes.
Dimensional Layers of a Professional Map
A professional map isn't a flat diagram; it contains three distinct dimensional layers. The Strategic Layer defines the overarching value chain and high-level business goals. Below this, the Operational Layer details the step-by-step workflows and specific task ownership, ensuring every team member knows their exact function. Finally, the Technical Layer identifies automation points and AI integration opportunities. This multi-layered approach ensures that the architecture is both human-readable and machine-ready.
Standard Symbols and Clinical Notation
Standardized notation is the universal language of operational efficiency. Using the "Suppliers-Inputs-Process-Outputs-Customers" (SIPOC) model allows for a high-level overview of how value flows through the enterprise. During the mapping process, we specifically flag "Critical Failure Points", the stages where a process is most likely to break down. Clinical notation ensures that the entire team interprets the map identically, removing the ambiguity that often leads to operational bottlenecks. This rigorous documentation, provided through expert business process mapping services, is the foundation upon which a scalable engine is built.
Comparing Mapping Frameworks: Which Protocol Fits Your Business?
Selecting an operational framework is not a matter of preference; it's a matter of technical suitability. A comprehensive Business X-Ray™ requires a multi-tiered approach that views the enterprise through different focal lengths. While one framework might identify waste in a fulfillment cycle, another is necessary to define workforce accountability. Professional business process mapping services deploy these protocols strategically to ensure every functional system is calibrated for growth. Without this tiered analysis, a founder risks applying a macro solution to a micro pathology, leading to continued system failure.
SIPOC: The Macro-Diagnostic Tool
The SIPOC diagram serves as the macro-diagnostic lens for the modern enterprise. It aligns senior management by defining the high-level boundaries of the business machine: Suppliers, Inputs, Process, Outputs, and Customers. This protocol is essential for identifying external dependencies that threaten operational stability. In the Indian corporate environment, where supply chain volatility can disrupt fulfillment, mapping these boundaries ensures that core value delivery remains intact regardless of external shifts. It provides a "bird's eye" view that is necessary before diving into granular task documentation.
Beyond the macro view, Value Stream Mapping (VSM) targets inefficiencies within fulfillment cycles. It quantifies the time and resources consumed at each stage, highlighting where "waste" creates friction and stalls the Business Acceleration Engine™. Functional flowcharts then bridge the gap between process and people. These charts are the prerequisite for clear delegation, ensuring that every task has a defined owner and a measurable output. This ensures the enterprise DNA is documented at every level of the hierarchy.
Swimlane Diagrams: Engineering Accountability
Swimlane diagrams provide the structural solution to the "I thought he was doing it" syndrome that plagues scaling teams. By organizing tasks into distinct lanes based on department or specific role, these diagrams clearly define hand-offs between functional units. This allows for a precise audit of workforce performance. You can identify "bottleneck individuals" whose delays stall the entire operational engine. When integrated with a Workforce X-Ray™, swimlanes transform vague team roles into a transparent architecture of accountability. This level of detail is what separates high-performance business process mapping services from basic flowcharting exercises.
A 5-Step Protocol for Implementing Process Mapping Services
The transition from operational chaos to a scalable machine is achieved through a rigorous, five-phase implementation protocol. This is not a collaborative brainstorming session; it is a top-down clinical intervention designed to extract the enterprise DNA and formalize it into a functional architecture. By utilizing professional business process mapping services, founders can move beyond the "hustle" and install a predictable system that operates with mechanical precision. Each phase is designed to eliminate ambiguity and replace it with structural certainty.
Phase 1 & 2: Setting the Diagnostic Parameters
The first stage of the protocol is Diagnostic Scope. Founders often make the mistake of attempting to map the entire organization simultaneously, which leads to analytical paralysis. You must select the high-friction area that offers the maximum ROI, typically within your acquisition or fulfillment systems. Once the scope is defined, we move to Phase 2: Data Extraction. This involves interviewing Subject Matter Experts (SMEs) to capture the unwritten rules of your operations. These experts often operate on intuition, so the extraction process must be objective and clinical to remove personal bias. A Standard Operating Procedure (SOP) is the physical manifestation of a process map, serving as the definitive instruction set for human or machine execution.
Phase 3 & 4: Visual Architecture and Bottleneck Analysis
Phase 3 involves drafting the current-state diagnostic map. This visual architecture serves as the "X-Ray" of your current workflows, revealing every hidden redundancy and manual workaround. With the map finalized, we enter Phase 4: Bottleneck Analysis. This is a quantitative exercise where we measure the time-to-completion at every map node. By identifying where processes stall or where "waste" cycles consume capital, we can diagnose the specific pathologies preventing scale. This phase identifies the exact points where the Business Acceleration Engine™ is losing power, allowing for precise engineering adjustments before the new protocol is finalized.
Phase 5: Protocol Installation and Systematic Repair
The final stage is Phase 5: Protocol Installation. This is the transition from a theoretical blueprint to an active operational system. Standardizing the map into actionable SOPs ensures that every team member follows the same calibrated path. To ensure the team actually adheres to these new standards, we utilize the Workforce X-Ray™ to monitor performance and identify any deviations from the mapped processes. This constant feedback loop ensures that the system remains optimized and that founder dependency is permanently removed. To begin your journey toward operational clarity, you can book your Business X-Ray™ diagnostic scan today. This methodical approach ensures that your growth is not a matter of luck, but a result of superior architecture.
Beyond Mapping: Installing the Business Acceleration Engine™
A schematic is not a functional machine. While business process mapping services provide the essential diagnostic blueprint, the actual value lies in the subsequent installation of the Business Acceleration Engine™. Many founders stop at the documentation phase, mistakenly believing that a clean diagram solves operational friction. It doesn't. A map merely identifies where the engine is stalling. To achieve clinical efficiency, you must transition from manual workflows to a high-performance architecture powered by AI Tech Business Integration. This shift ensures that the "Decision Nodes" identified during your diagnostic scan are no longer dependent on human fallibility.
Integrating AI and Automation Protocols
The visual architecture created during the mapping phase highlights specific "Automation-Ready" steps. These are repetitive, high-volume administrative cycles that drain your enterprise's cognitive resources. By embedding AI into these core workflows through the AI Tech Business Integration Bootcamp, you reduce operational costs and eliminate human error. Automation protocols transform static SOPs into dynamic, self-executing systems. This reduces the friction in your acquisition and fulfillment funnels, allowing the machine to process higher volumes without increasing headcount. It's the difference between a manual process and a calibrated engine.
Achieving the "Founder-Independent" Enterprise
The ultimate ROI of a systems-driven architecture is the removal of founder dependency. Mapped systems allow the owner to move from the role of "Operator" to that of "Architect." You no longer need to intervene in daily tasks because the protocols dictate the output. By using the Financial Command Dashboard, you manage the enterprise by exception rather than constant intervention. You only step in when the data deviates from the calibrated norm. This creates a predictable and scalable growth engine that functions independently of your presence. It's about building an asset that works for you, rather than a job you can't leave.
Continuous operational auditing is maintained through the Business X-Ray™ framework. This ensures that as the Indian market evolves, your systems remain optimized and free of new bottlenecks. You don't just build the engine once; you calibrate it for permanent performance. This rigorous approach to management ensures that your scaling efforts are backed by structural integrity rather than frantic energy.
Schedule your Business X-Ray™ to diagnose your operational bottlenecks today.
Calibrating Your Enterprise for Scalable Autonomy
Operational excellence is the result of structural integrity, not individual heroics. You've seen how professional business process mapping services provide the clinical blueprint required to move from a founder-dependent model to a scalable architecture. By documenting your enterprise DNA through a multi-tiered diagnostic lens, you create the foundation for permanent efficiency. This documentation is the prerequisite for installing a high-performance engine that operates with mechanical precision across every department.
True transformation begins when you move beyond static diagrams and install active systems. Our proprietary Business X-Ray™ framework identifies the hidden pathologies in your workflows, while the specialized AI Tech Business Integration Bootcamp ensures your team is equipped for automated delegation. With a data-driven Financial Command Dashboard, you gain the transparency needed to manage by exception rather than constant intervention. It's time to stop repairing symptoms and start re-engineering the machine for predictable growth.
Request Your Business X-Ray™ Diagnostic Scan
Your business is a solvable puzzle of logic and process. We look forward to helping you architect a sustainable, high-performance asset that functions independently of your daily input.
Frequently Asked Questions
What is the difference between process mapping and process modeling?
Process mapping is the clinical documentation of current operational reality, whereas process modeling is the mathematical simulation of hypothetical future states. While mapping identifies the existing enterprise DNA, modeling allows for stress-testing new architectures before they are installed. This diagnostic distinction is critical for founders who need to understand their current bottlenecks before attempting to simulate a more efficient acceleration engine.
How long does a typical business process mapping project take to complete?
A comprehensive diagnostic cycle typically requires four to eight weeks for full implementation. This timeline accounts for the initial diagnostic scan, data extraction from subject matter experts, and the drafting of the visual architecture. Prioritizing high-friction systems like fulfillment ensures that the enterprise sees a structural return on investment early in the process mapping lifecycle.
Is business process mapping suitable for small businesses or only large enterprises?
Structural integrity is a prerequisite for growth, making process mapping vital for small enterprises and large corporations alike. Small businesses often face higher risks due to extreme founder dependency and a lack of transparent performance metrics. Installing professional business process mapping services early prevents the operational chaos that typically stalls Indian startups as they attempt to scale into mature enterprises.
Can business process mapping help in reducing my operational costs?
Mapping identifies the specific nodes where capital is wasted due to redundancy or manual friction. By quantifying the time-to-completion at every stage of your fulfillment cycle, you can eliminate the waste cycles that inflate operational costs. This clinical approach ensures that every rupee spent on labor or technology contributes directly to the efficiency of the business machine.
What tools should I use for mapping my business processes?
We recommend using standardized notation tools such as Microsoft Visio or Lucidchart to ensure team-wide interpretation. However, the specific software is merely the drafting board. The true value lies in the clinical protocol used during the diagnostic phase to capture unwritten rules. Professional business process mapping services focus on the accuracy of the underlying data rather than just the visual aesthetics of the diagram.
What happens if my team refuses to follow the newly mapped processes?
Resistance to new protocols is usually a symptom of poor workforce alignment or an incomplete installation phase. By integrating a Workforce X-Ray™, you can gain transparency into individual performance and identify exactly where the protocol is breaking down. Management by exception allows you to address these specific bottlenecks without returning to the role of a reactive operator.
How often should a business update its process maps?
Operational architecture should be audited quarterly to ensure the system remains calibrated with market demands. As you integrate new technologies or expand your service offerings, the enterprise DNA shifts. Regular scans through the Business X-Ray™ framework allow you to update your maps, ensuring that your SOPs remain the definitive instruction set for your team and machines.
How does process mapping help in preparing for AI integration?
You don't effectively automate a broken or undocumented workflow. Mapping identifies the specific decision nodes that are automation-ready, allowing for a surgical integration of AI protocols. This preparation is the essential first step before attending an AI Tech Business Integration Bootcamp, as it ensures the technology is installed into a stable and predictable operational environment.


