

A crowded dashboard can hide the cash warning that matters most. Key financial metrics for service businesses are selected indicators of financial health, including profitability, liquidity, solvency and efficiency. A practical starting point is to track five to seven KPIs that inform decisions. For an Indian service business, cash flow, gross profit margin and measures suited to the delivery model provide a useful diagnostic core.
Financial measures should show whether work is profitable and whether cash can cover obligations. Revenue alone does not reveal delivery costs, collection delays or which services and clients contribute most. KPIs turn these factors into signals owners can review and act on.
This article explains what KPIs are, why they matter and how to calculate and interpret gross profit margin and liquidity measures. It also shows how to choose indicators that reflect your services, customers and operating model, so reviews support decisions instead of adding dashboard noise.
Key Takeaways
- Calculate gross profit margin by service to identify which work is absorbing delivery costs and which may support stronger pricing decisions.
- Assess liquidity with working capital, current assets against current liabilities, and the timing of customer collections.
- Track recurring revenue alongside delivery and collection measures to understand how predictable income supports cash planning.
- Select KPIs that reflect your customers, services, projects and team capacity, then use them to guide specific operating decisions.
1. Gross profit margin
Gross profit margin shows how much net sales remain after direct delivery costs. Calculate it as (net sales − cost of goods sold) ÷ net sales × 100%. Net profit margin uses a different base: net income ÷ revenue × 100%. The first tests service delivery economics; the second reflects profitability after all expenses.
For a useful diagnosis, calculate gross profit by service line and client. Subtract each service’s direct labour and other delivery costs from its revenue, then compare the margins. Timesheets can help assign staff effort; allocate shared direct costs according to usage. A project with high sales can still have weak gross profit if delivery hours exceed the estimate.
Net profit margin adds the wider operating picture, including expenses beyond direct delivery. Read the two margins together: strong gross margin with weak net profit points to overhead or other operating costs, while weak gross margin calls for a closer look at pricing, scope or delivery efficiency. Use these indicators to inform pricing, but don’t discontinue a low-margin service automatically: it may support other services or generate leads.
There’s no universal healthy customer acquisition cost (CAC) or customer lifetime value (CLV) for every service business. Calculate CAC by dividing sales and marketing costs by new customers. Calculate CLV as customer value multiplied by average customer lifespan. A CLV-to-CAC ratio above one means lifetime revenue exceeds acquisition spend, before wider costs.
Estimate break-even sales by dividing fixed costs by contribution margin, the share of each sale available to cover those costs. To assess project profitability, subtract direct project costs from project revenue, then compare the result with planned labour and delivery costs. Review margins by client, offering and industry to see where growth improves profit, efficiency and cash flow, or strains working capital.
2. Liquidity and short-term obligations
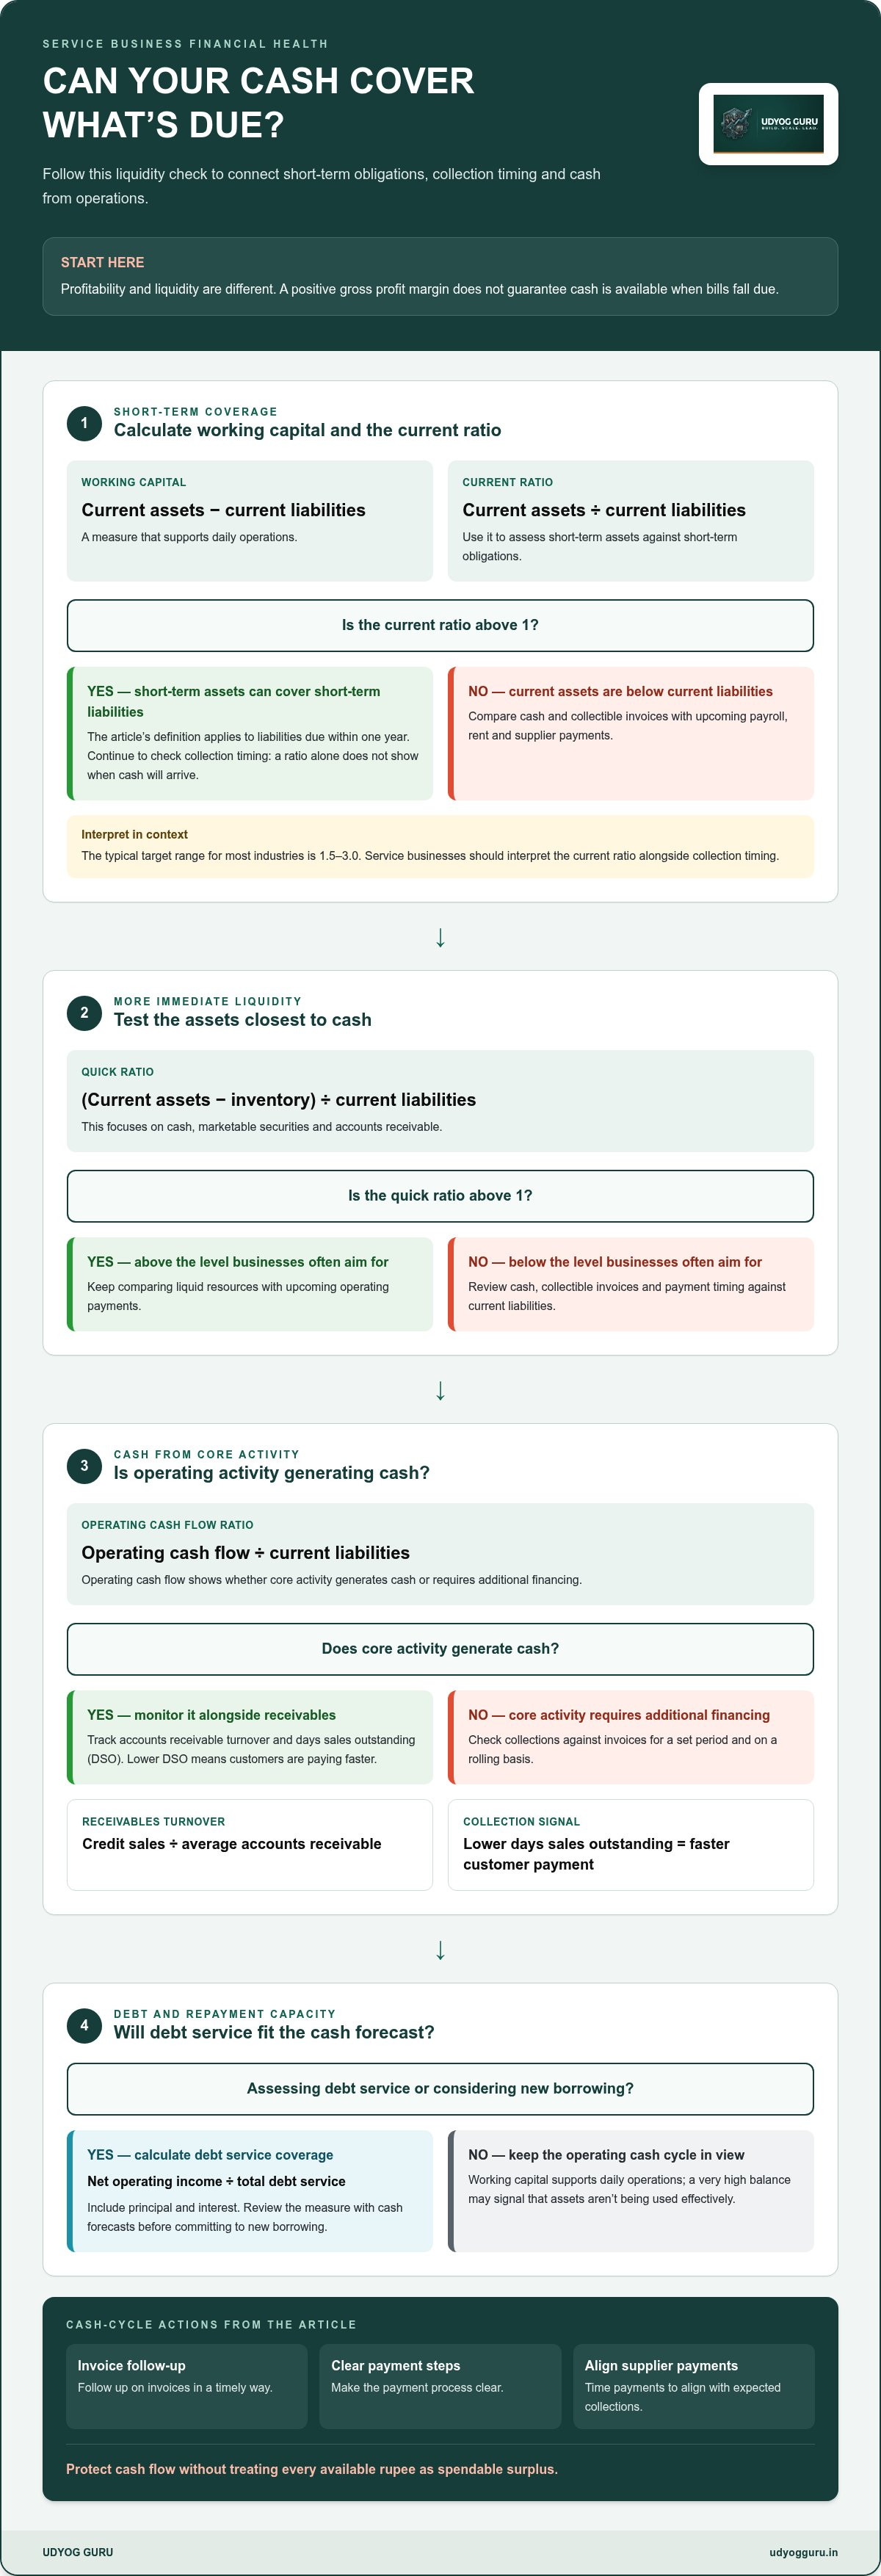
Profitability and liquidity measure different conditions: a positive gross profit margin doesn’t guarantee cash is available when bills fall due. Start with working capital, calculated as current assets minus current liabilities. Then calculate the current ratio by dividing current assets by current liabilities. A ratio above 1 indicates short-term assets can cover short-term liabilities due within one year; the typical target range for most industries is 1.5-3.0, although service businesses should interpret it alongside collection timing.
For a more immediate liquidity test, calculate the quick ratio: subtract inventory from current assets, then divide by current liabilities. It focuses on cash, marketable securities and accounts receivable. Businesses often aim for a quick ratio above one. Compare cash and collectible invoices with upcoming payroll, rent and supplier payments to assess the ability to meet operating obligations.
Operating cash flow shows whether core activity generates cash or requires additional financing. Calculate the operating cash flow ratio by dividing operating cash flow by current liabilities. Monitor it alongside receivables: accounts receivable turnover equals credit sales divided by average accounts receivable, while lower days sales outstanding means customers are paying faster. Compare collections with invoices for a set period and on a rolling basis.
Working capital supports daily operations, but a very high balance may signal that assets aren’t being used effectively. Improve the cycle with timely invoice follow-up, clear payment steps and supplier payments aligned with expected collections. These actions protect cash flow without treating every available rupee as spendable surplus.
Debt adds another liquidity pressure. Calculate the debt service coverage ratio by dividing net operating income by total debt service, including principal and interest. Review this measure with cash forecasts before committing to new borrowing, and align repayment capacity with business objectives. If financial indicators are fragmented, a structured financial KPI review can help connect liquidity measures to operational decisions.
3. Why Are Financial Metrics and KPIs Important to Your Business?
Monthly recurring revenue (MRR) tracks contracted service income expected to recur each month. Record active retainer or managed-service fees separately from one-off project revenue. This distinction shows how much income is predictable and helps connect renewals and cancellations to cash planning and liquidity.
Revenue growth shows whether sales are expanding or contracting across periods. Calculate the sales growth rate as current-period net sales minus prior-period net sales, divided by prior-period net sales, then multiplied by 100%. Compare equivalent periods and review expenses alongside growth; increased sales do not establish improved profitability if delivery costs rise faster.
For a service business, revenue per employee can offer a way to assess efficiency. Exclude administrative employees, as well as revenue not generated by staff, such as referral or resale commissions and royalties. Compare the measure over consistent periods to assess how efficiently staffing capacity generates revenue. Since labour is often more central than inventory in a service model, interpret the indicator alongside utilisation and delivery costs.
Revenue concentration shows dependence on particular clients, industries or contracts. Group revenue by client and industry, then review renewal dates, contract scope and the operational impact of losing an account. A large contribution from one client can put future revenue and cash flow at risk at renewal, even when current accounting results appear stable.
Average bill rate adds a delivery-level view. Divide the dollar value of work in progress by the hours required to produce it to calculate the average gross bill rate. Multiply that rate by the realisation percentage to calculate the average net bill rate. Compare both with employee costs and project outcomes to see whether billed work converts into collected revenue.
There is no single healthy billable utilisation rate for every Indian consulting or professional services firm. Calculate utilisation as billable hours divided by available hours, defining availability consistently around leave, training and other time unavailable for billable work. Interpret the result cautiously: a target that discourages paid time off or encourages inaccurate client billing can distort decisions.
4. Financial KPI selection for service businesses
Choose measures that connect to a decision, not just figures available in accounting software. Start with five to seven KPIs, such as cash flow, gross margin, customer acquisition cost, recurring revenue and revenue per employee. Define an owner, calculation, data source and review period for each. This creates a usable operating system instead of a dashboard crowded with indicators.
For an Indian service business, a monthly review can combine cash flow, gross profit margin, operating expenses, receivables, revenue growth and employee utilisation. Together, these measures show whether sales are converting into cash, direct delivery costs are controlled and staffing capacity matches demand. Track customer acquisition cost when growth depends on new customers; include retention or recurring revenue when contracts renew over time.
GST and TDS affect cash-flow visibility through the timing and amount of receipts and payments. In your monthly forecast, separate customer invoices from cash collected, record GST-related cash movements distinctly and track TDS withheld from receipts separately from available bank funds. This keeps invoice revenue from being mistaken for spendable cash and helps reconcile accounting records with actual liquidity.
Make comparisons consistent: use the same period and calculation for each KPI, then review changes against prior periods and business objectives. Segment measures by client, service line, project type or location to identify differences. To assess resource efficiency, compare revenue per employee with direct labour costs; for capital management, consider working capital and asset use. Small businesses can start with a spreadsheet before adopting more complex reporting.
Assign an owner to investigate sustained changes and record the action taken, such as revising project estimates or following up overdue invoices. A financial KPI dashboard can bring selected measures into a consistent review structure.
Udyog Guru: Business X-Ray™ (Tier 1)
Udyog Guru’s Business X-Ray™ (Tier 1) helps business owners assess how their business systems are functioning and identify areas that need attention. It can be a relevant next step when financial measures show recurring pressure, but the underlying causes span service delivery, team performance or operational processes.
Use KPI findings as diagnostic inputs. Identify which services or workflows affect margins, cash collection and capacity, then connect those signals to the wider business structure. If the assessment points to growth or workforce challenges, Udyog Guru’s Business Acceleration Engine™ or Workforce X-Ray™ may be a relevant next step. The goal is to move from tracking numbers to understanding the operating conditions behind them.
To discuss how Business X-Ray™ fits your business, contact Udyog Guru or visit udyogguru.in.
Turn Financial Visibility Into Your Next Decision
The next step isn’t adding more metrics. Connect each measure to an owner, a decision and a review routine. When key financial metrics for service businesses sit within that operating structure, leaders can distinguish a temporary fluctuation from a process that needs attention, then respond deliberately.
Where financial patterns point to broader operational constraints, Udyog Guru’s Business X-Ray™ (Tier 1) can help assess the business system. Business Acceleration Engine™ (Tier 2) and Workforce X-Ray™ address related business transformation and workforce optimization needs. The next move depends on whether the issue sits in the operating model, execution or team performance.
Use the figures you already track to define the next question your team must resolve. Contact Udyog Guru today to discuss a structured next step for your business. Clear measurement can become a practical foundation for stronger decisions.
Frequently Asked Questions
What Are KPIs?
KPIs, or key performance indicators, are selected measures used to assess progress toward a business objective. A service firm might track client retention to assess relationship stability and project delivery times to identify workflow delays. A useful KPI has a clear definition, a consistent data source and an owner who interprets changes and decides what action to take.
What Is a Financial KPI?
A financial KPI measures a business’s financial condition or results, such as profitability, liquidity, solvency or efficiency. For example, a leader comparing operating costs with revenue can investigate whether spending patterns are affecting earnings. Unlike a raw accounting entry, a KPI is selected and interpreted to guide a decision, such as adjusting a budget, revising a forecast or prioritising collections.
Why Are Financial Metrics and KPIs Important to Your Business?
Financial metrics help leaders spot changes early and connect them to operating decisions. A monthly review might reveal steady revenue alongside rising expenses, prompting an investigation into project scope, staffing or supplier costs. Sharing relevant indicators with managers clarifies responsibility: teams can see which outcomes they influence and respond before an emerging issue becomes persistent.
What are the most important financial metrics for service businesses?
Key financial metrics for service businesses typically cover profitability, liquidity, growth and delivery efficiency. A practical dashboard might pair gross margin by service with operating cash flow, receivables timing, revenue growth and revenue per employee. The right selection depends on the business model: a retainer-based consultancy may prioritise renewals, while a project agency may focus on scope control and delivery costs.
What is a good operating profit margin for service businesses in India?
There is no single operating profit margin that defines a healthy service business in India. Interpret the measure against your historical results, service mix, staffing structure and operating expenses, comparing like-for-like periods. Investigate a pricing or volume trend that persists for three or more periods; a brief change alone may not signal a structural problem.
How do you calculate revenue per employee and utilization rate for service businesses?
Calculate revenue per employee by dividing revenue by the number of employees, excluding administrative employees. Calculate employee utilisation by dividing billable hours by available hours. For a meaningful comparison, use the same period for both and define available hours consistently, excluding time unavailable for billable work, such as holidays, paid leave, training or lunch.


