

A team can look fully occupied while important work continues to pile up. That’s why operational bottlenecks identification can’t rely on visible busyness or the slowest-looking task. The real constraint is the point where capacity falls short of demand and limits flow across the system.
If delays recur across handoffs, departments, or approval steps, the cause may sit deeper than one overloaded employee. A quick fix might clear today’s queue without changing the conditions that created it. Start by defining the workflow and checking what the evidence shows.
This guide explains how to trace constrained flow using observable indicators such as work-in-progress, waiting time, rework, and capacity. You’ll learn to distinguish a temporary disruption from a structural constraint, test whether the cause lies in process design, workforce coordination, or another part of the operation, and prioritise a practical response before committing to automation or redesign. Udyog Guru’s Business X-Ray™ offers a structured diagnostic to help organise operational evidence before implementation decisions are made.
Key Takeaways
- Use operational bottlenecks identification to locate the constraint limiting end-to-end output, rather than assuming the most visible queue is the cause.
- Compare waiting time, cycle time, rework, and downstream completion to test whether a suspected step is restricting flow.
- Trace one defined workflow from start to completion, then map it and establish a baseline before testing possible constraints.
- Separate temporary disruption from recurring capacity, sequence, decision, rework, or information-flow problems before selecting a response.
- Complete diagnosis before implementation. The evidence may point to redesign, clearer decision rights, workforce changes, measurement, or automation.
Operational Bottlenecks Identification: What a Constraint Looks Like in Business
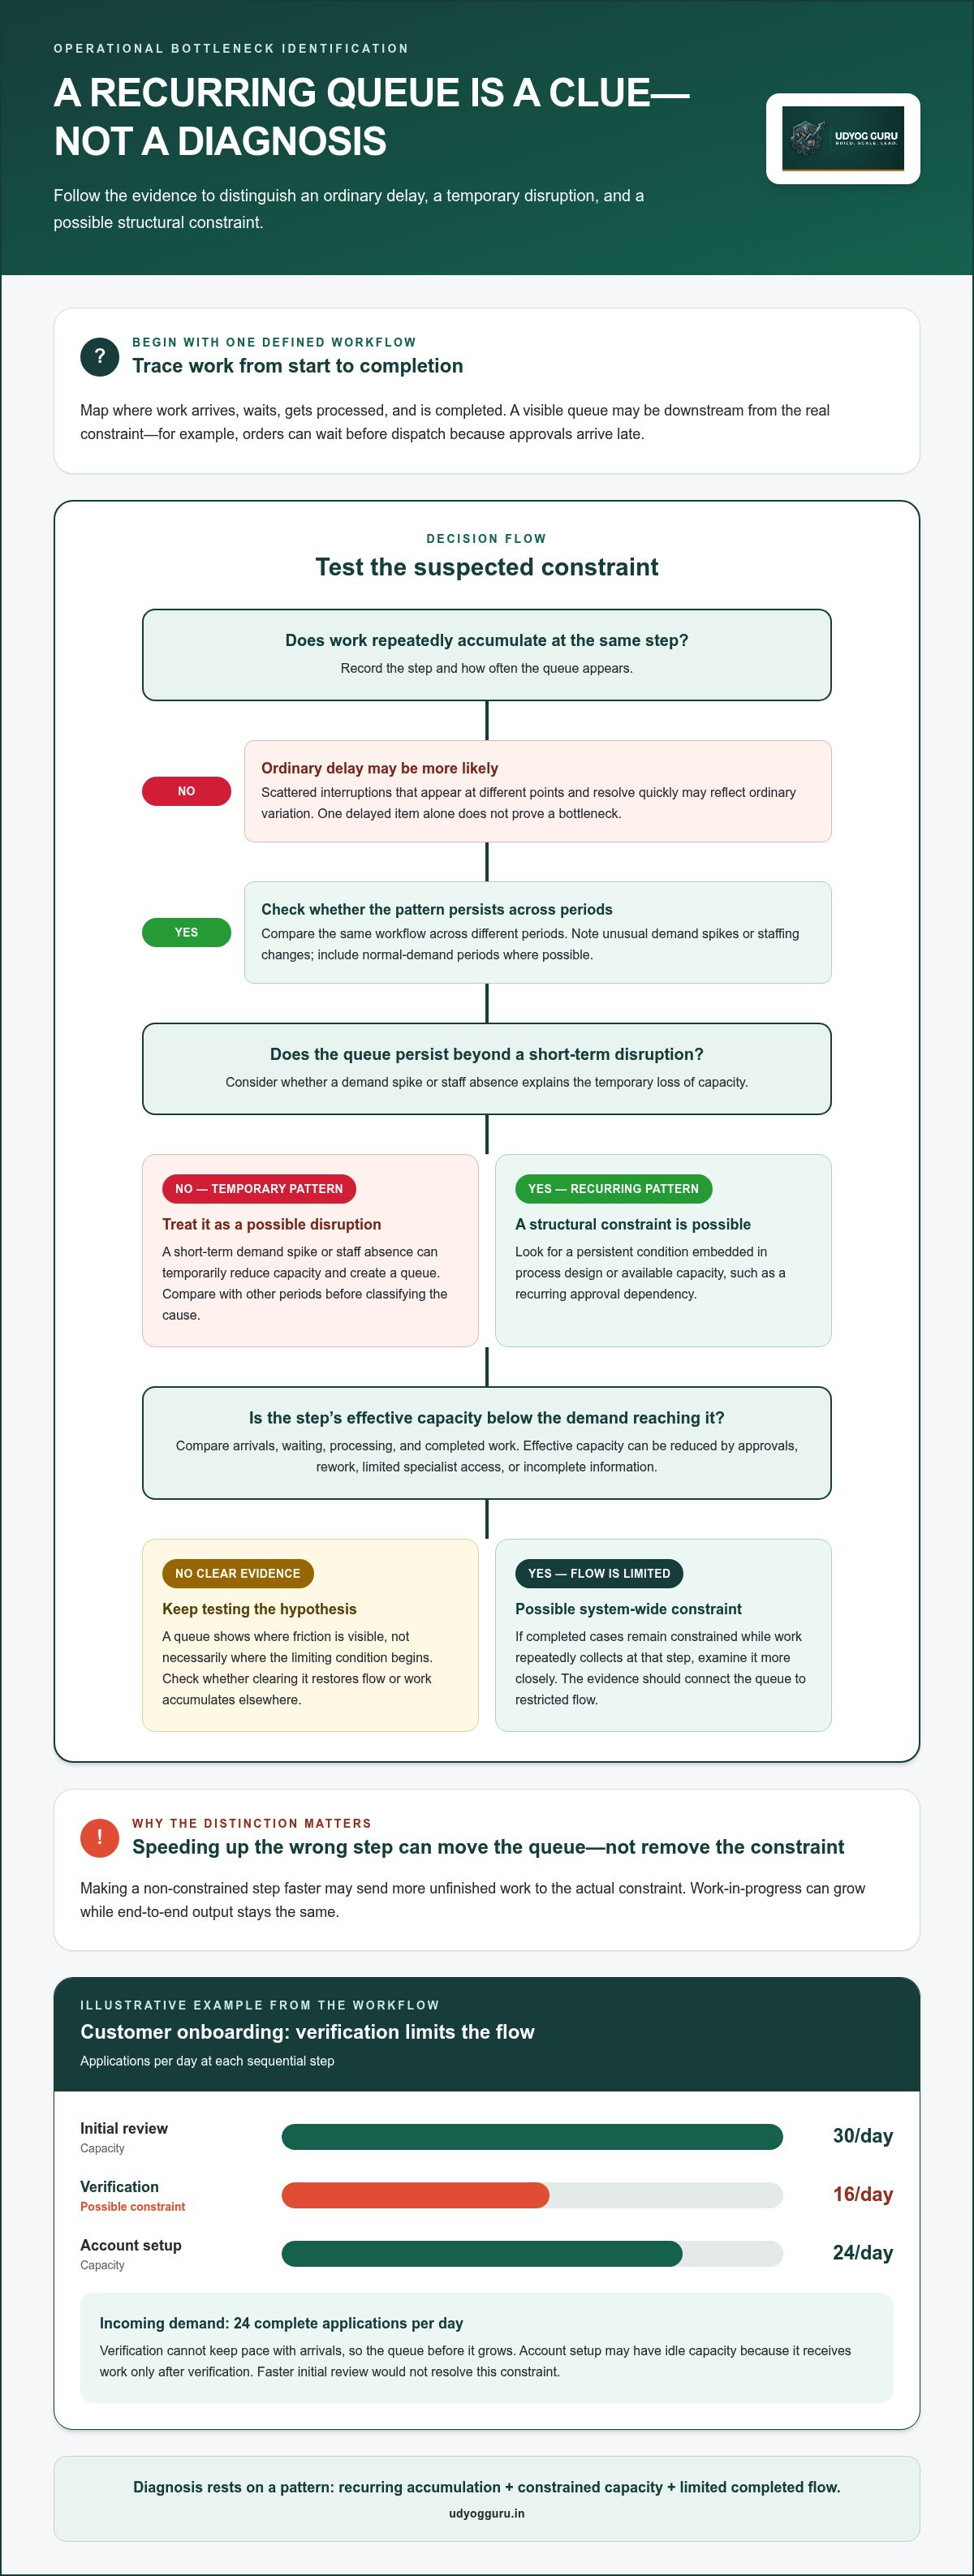
An operational bottleneck is a step, resource, or decision point whose capacity is insufficient for the demand placed on it, limiting the flow or total output of the process. A local delay affects one item or occasion. A system-wide constraint repeatedly caps how much work the entire process can complete. This distinction is central to operational bottlenecks identification: a visible queue is a clue, not a diagnosis.
Queues, missed handoffs, employee pressure, and late orders are symptoms. They show where friction is visible, but not necessarily where the limiting condition begins. For example, orders may accumulate before dispatch because approvals arrive late, even when dispatch has enough capacity. The constraint may be upstream in the decision process, not at the point where work is waiting.
Production theory treats a bottleneck as a constraint that shapes throughput across the wider system. This overview of operational bottlenecks in production provides useful context, but each business still needs to test its own workflow. Making a non-constrained step faster may simply send more unfinished work to the actual constraint. The queue shifts or grows, while end-to-end output stays the same.
How to distinguish a bottleneck from an ordinary delay
An isolated delay can clear without changing a workflow’s sustained output. A recurring accumulation before the same step is stronger evidence of a possible constraint, especially when downstream completion remains limited. By contrast, scattered interruptions that appear at different points and resolve quickly may reflect ordinary variation. Treat a suspected bottleneck as a hypothesis, then compare records of arrivals, waiting, processing, and completed work before deciding.
Consider a service workflow where requests sometimes wait for a manager’s approval. One delayed request does not prove that approval is the bottleneck. If requests repeatedly collect at that stage and completed cases remain constrained even when other steps are ready, examine the approval process more closely. The evidence should connect the queue to restricted flow, not merely show that waiting occurred.
Temporary disruption or structural constraint?
A short-term demand spike or staff absence can temporarily reduce capacity and create a queue. A structural constraint is more persistent, embedded in the process design or available capacity. Examples include a recurring approval dependency or a step that regularly receives more work than it can process. Compare patterns across different periods, including normal-demand periods where possible, before classifying the cause.
Use a simple evidence check to keep the diagnosis disciplined:
- Where does work accumulate? Record the step and how often the queue appears.
- Does the pattern persist? Compare the same workflow across periods, noting unusual demand or staffing changes.
- What happens to total output? Check whether clearing the delay restores flow or whether work continues to accumulate elsewhere.
A sound diagnosis separates the location of a symptom from the condition restricting the whole process. That distinction gives the next stage of analysis a reliable starting point.
How Operational Bottlenecks Form Across Workflow Capacity and Demand
A workflow becomes congested when work arrives at a step faster than that step can process it. The difference accumulates as waiting work, extends completion time, and can disrupt later stages. Capacity is the amount of work a step can reliably process within a stated period. Throughput is the amount of completed work that moves through the full process during that period.
The slowest effective step constrains total process throughput because every completed item must pass through it. “Effective” matters: a step’s practical capacity may be reduced by approvals, rework, limited access to a specialist, or incomplete information, even if its hands-on task appears brief. Increasing activity at an upstream stage can therefore increase work-in-progress without increasing finished output.
Capacity, queue size, and throughput
Consider this illustrative example only: a customer onboarding workflow receives 24 complete applications per day. Initial review can process 30 per day, verification can process 16, and account setup can process 24. If the steps operate in sequence, verification cannot keep pace with arrivals. The queue before it grows, while account setup may have idle capacity because it receives work only after verification.
Making initial review faster would not resolve the constraint. It could send even more applications into the queue. The useful question is not simply which step takes longest per item, but whether a step’s reliable capacity is below the demand reaching it and limits the number of completed cases. This helps teams see how an initial mismatch affects flow instead of treating each queue as a separate problem.
Where constraints appear beyond production
The same capacity-demand pattern can arise in approvals, customer onboarding, sales handoffs, finance processing, or decision-making. A sales team may pass qualified leads forward faster than the next team can assess them. Finance may face recurring payment exceptions that require review by one specialist. These examples point to possible mechanisms, not proof: a queue that clears quickly or does not restrict downstream completion may be routine variation.
Handoffs can amplify a constraint. Missing information sends work back for correction, and each return uses capacity that could have handled new cases. Waiting between departments also extends the time work spends in progress, even when no team is actively processing it. If every exception depends on one role, that role can become a single-point constraint, especially when demand rises or the person is unavailable.
For operational bottlenecks identification, follow the chain: incoming demand, step capacity, queue growth, rework or waiting, and completed output. This pattern shows where a mismatch may propagate, but it still needs to be tested against workflow evidence. A structured diagnosis such as Business X-Ray business diagnosis can help establish the process-level picture before deciding whether to address capacity, handoffs, workforce systems, or another cause.
How to Verify the Real Operational Bottleneck, Not Just the Visible Queue
A visible queue identifies where work is waiting, not necessarily why it is waiting or whether it limits total output. To verify a constraint, compare signals across the workflow: queue size, time spent waiting, time spent being processed, rework, and completed work leaving the final stage. A suspected step is more likely to be a true bottleneck when recurring accumulation coincides with restricted downstream completion, rather than appearing as an isolated delay.
Start by separating waiting time from processing time. A task may take little effort but sit untouched for a long period, or require substantial work without creating a queue. Combining both into one cycle-time figure can hide the difference. Record work-in-progress, completed output, rework, and missed service expectations at each relevant stage. Use the same definitions and comparison windows across teams and periods, or apparent differences may reflect inconsistent measurement rather than a real constraint.
Which operational signals should be measured?
Build a concise evidence log. For each signal, specify where it appears, what might explain it, and what observation would validate that explanation. Staff feedback can reveal undocumented handoffs, workarounds, or recurring information gaps. Treat it as diagnostic input, then test it against workflow records and observed cases. If recollections and data conflict, examine how work is recorded before deciding which account reflects the process.
- Signal: A recurring queue. Where observed: Before a review stage. Possible cause: Limited review capacity. Validation evidence: Arrivals repeatedly exceed completed reviews, and downstream work waits for release.
- Signal: High rework. Where observed: At a correction or return step. Possible cause: Incomplete inputs or unclear requirements. Validation evidence: Returned cases consume capacity and correlate with slower final completion.
- Signal: Missed service expectations. Where observed: Across the full workflow. Possible cause: A queue, handoff gap, or another delay. Validation evidence: Case histories show where elapsed time accumulates and whether that stage limits completed output.
How to test a suspected root cause
Follow a sample of work from entry to completion. Record timestamps, handoffs, pauses, returns, and the reason each item waits. Then compare cases or periods with different workloads. If the same stage repeatedly accumulates work as demand increases, while final completions remain constrained, the hypothesis gains support. If the queue clears without affecting total output, it may be a local delay rather than the system constraint.
Use the 5 Whys to investigate why the pattern occurs, not to prove that the suspected step limits flow. Each answer should lead to a testable explanation, such as a repeated information defect or a decision dependency. Strong operational bottlenecks identification triangulates staff observations, process records, and end-to-end completion evidence before the team selects a response.
A Practical Operational Bottleneck Identification Protocol for Your Team
A useful diagnosis has a clear boundary, a repeatable baseline, and evidence connecting a suspected constraint to the workflow’s completed output. Keep the investigation narrow enough to follow work from a defined entry point to a defined outcome. Avoid changing staffing, sequence, tools, or automation before recording how the process currently performs. Otherwise, you may alter the evidence before understanding the cause.
Set the diagnostic scope and map the work
Choose one business outcome, such as a completed customer onboarding, and specify exactly when a case enters and exits the workflow. Map the roles, decisions, handoffs, queues, systems, and exception paths between those points. The map should reflect actual work, including informal steps, rather than an idealised procedure.
- Define the workflow. State the outcome being examined and the start and end points. Note what is excluded so the scope does not expand mid-diagnosis.
- Map the work. Trace the normal route and exceptions, recording who handles each step, what information is required, and where work waits or returns.
- Establish a baseline. Before making changes, record arrivals, work-in-progress, waiting and processing time, rework, and completed output using consistent definitions and time windows.
- Test the suspected constraint. Compare the map with observed cases and baseline data. Check whether the suspected step repeatedly accumulates work and restricts downstream completion, rather than merely showing occasional delay.
- Document the finding. Record the suspected constraint, supporting evidence, its downstream effect, alternative explanations, and unanswered questions. Separate verified observations from assumptions.
This sequence creates a stopping point for diagnosis: the team has a bounded workflow, a baseline, and evidence supporting or challenging a constraint hypothesis. It does not mean the cause is fully resolved. The next decision is about implementation, and the response should match the verified finding rather than the first visible symptom.
Baseline, validate, and record the finding
Collect observations across representative normal operating conditions, not only during a peak or disruption. If a pattern changes with workload, record that context. Otherwise, a temporary variation may be mistaken for a structural limit. Use relevant business performance metrics to track flow and completion, and keep measurement definitions stable when comparing periods or teams.
For a structured diagnostic stage before implementation, Business X-Ray™ is Udyog Guru’s Tier 1 diagnostic offering. It helps organise evidence before you decide whether to redesign, delegate, measure, or automate.
Use this protocol to establish what the evidence supports, then determine the appropriate response. To begin a structured business diagnosis, explore Business X-Ray™.
From Bottleneck Identification to a Structured Business Response
Once evidence supports a constraint, choose a response that addresses its cause, not merely the visible queue. A capacity limit may call for reviewing workload distribution or available resources. A sequence problem may require changing the order of steps. Unclear decision rights, repeated rework, and incomplete information each point to different corrective actions. Operational bottlenecks identification is complete when the constraint and its effect are clear enough to inform a decision, not when a solution has already been selected.
Match the response to the diagnosed constraint
Use the verified cause to narrow the intervention. If recurring delay comes from unnecessary approvals or handoffs, process redesign may be more appropriate than adding a tool. If decisions repeatedly wait for one person, clarify authority or delegate defined decisions. If errors send work back for correction, address the source of rework before increasing downstream capacity.
Technology and automation may help when a workflow is repeatable and its rules, inputs, and exceptions are understood. Automating an unstable or poorly defined process can reproduce its friction faster without resolving the underlying issue. Before implementation, specify the intended change and the measures that will show whether the original constraint has shifted. Keep diagnosis and intervention distinct so the team can assess the change against its baseline.
When a structured diagnostic can help
A structured diagnostic is useful when evidence is spread across teams, handoffs, or operating measures and the cause remains uncertain. Udyog Guru’s Business X-Ray™ is its Tier 1 diagnostic offering, designed to examine business operations and identify gaps before implementation decisions are made. It supports the assessment stage; changing a process or putting a response in place comes next.
Business Acceleration Engine™ is Udyog Guru’s Tier 2 implementation offering, distinct from the diagnostic. Keeping these stages separate helps leaders move from evidence to a considered intervention instead of treating diagnosis and execution as one activity. Teams that need a repeatable method for defining scope, mapping work, baselining performance, testing a suspected constraint, and recording findings can revisit the operational bottleneck diagnostic protocol described earlier in this guide.
Before proceeding, summarise the verified constraint, the evidence behind it, its effect on completed work, and the response that appears proportionate. If evidence remains incomplete, identify what needs further measurement rather than committing prematurely to redesign or automation. This creates a decision point grounded in operational facts and gives implementation a defined problem to address.
To explore a structured approach to diagnosis and implementation, review Udyog Guru’s structured business systems.
Turn the Diagnosis into a Deliberate Next Step
The value of operational bottlenecks identification lies in the decision it makes possible. Once the evidence is clear, your next move can be proportionate to the constraint, rather than a broad change made under pressure. Treat the diagnosis as a decision point: preserve what is working, define what needs to change, and establish how you will assess the effect.
For organisations that need a structured starting point, Udyog Guru’s Business X-Ray™ is the Tier 1 diagnostic offering. It is distinct from the Business Acceleration Engine™, a separate Tier 2 implementation offering. This separation keeps assessment and execution clear, so the business can determine what response fits before moving into implementation.
Use the findings as a practical basis for your next operational decision. Explore Udyog Guru’s structured business diagnostic and implementation systems to consider a disciplined path from diagnosis to action. A clearer view of the constraint gives your team a sounder foundation for improving flow.
Frequently Asked Questions
What is the difference between an operational bottleneck and a process delay?
A process delay is a wait or interruption; an operational bottleneck is a recurring constraint that limits the process’s overall completion rate. For example, a supplier’s one-day system outage may delay a batch, then clear without changing normal output. If work continues to accumulate at the same approval step across ordinary operating periods, that pattern may indicate a constraint. Compare the effect on completed work, not just the duration of one delay.
Can a business have more than one operational bottleneck at the same time?
Yes, separate workflows can have different constraints, and a long workflow can expose a new one after the current constraint is relieved. For example, resolving a document-review backlog may reveal that final approval now limits completion. Avoid treating every slow stage as a simultaneous system bottleneck. Assess each workflow’s output and constraint, then recheck flow after a change, since capacity and demand can shift the limiting point.
How do you identify a bottleneck when a process has several departments?
Trace the same case across departments using a shared identifier, such as an order or application number. Record when each team receives, starts, returns, and completes it, along with the reason for any hold. This supports operational bottlenecks identification across handoffs, where each department may see only its own portion of the delay. Compare the case history with end-to-end completion to locate which stage or transition restricts the whole flow.
How much operational data do you need to identify a bottleneck?
There is no universal record count that proves a constraint. Start with enough comparable cases to see whether the suspected pattern recurs under ordinary conditions, and include a different workload period if demand varies. Capture consistent timestamps, queue levels, rework, and final completions. If records are incomplete, use direct observation to fill specific gaps, and mark estimates separately. The aim is evidence strong enough to test a hypothesis, not a large dataset for its own sake.
What happens if the visible queue is not the root cause?
Follow the waiting work both upstream and downstream. A queue before dispatch, for instance, may result from incomplete information arriving from sales, while dispatch itself has spare capacity. Check whether cases are waiting for an input, decision, correction, or available processing time. If the suspected step can clear its queue without raising final completion, revise the hypothesis and investigate the dependency that is actually restricting flow.
Can employee feedback help identify operational bottlenecks?
Yes. Employees often know where instructions are unclear, approvals stall, or work returns for correction. Ask people in different roles to describe a recent case, including what they received, what they needed, and where it waited. Compare accounts across the handoff rather than relying on one department’s view. Then test recurring observations against case records or direct workflow tracking, since perception can identify a lead but cannot establish its effect on total output alone.
Should a business automate a process as soon as it finds a bottleneck?
No. First determine whether the constraint comes from unclear rules, unnecessary approvals, decision ownership, capacity, or repeated data entry. Automation may suit a stable, repeatable task with defined inputs and exceptions; it is less likely to resolve a process that changes from case to case or routinely requires judgement. Document the current method and intended result before selecting technology. Otherwise, automation may encode the existing friction rather than remove its cause.


