

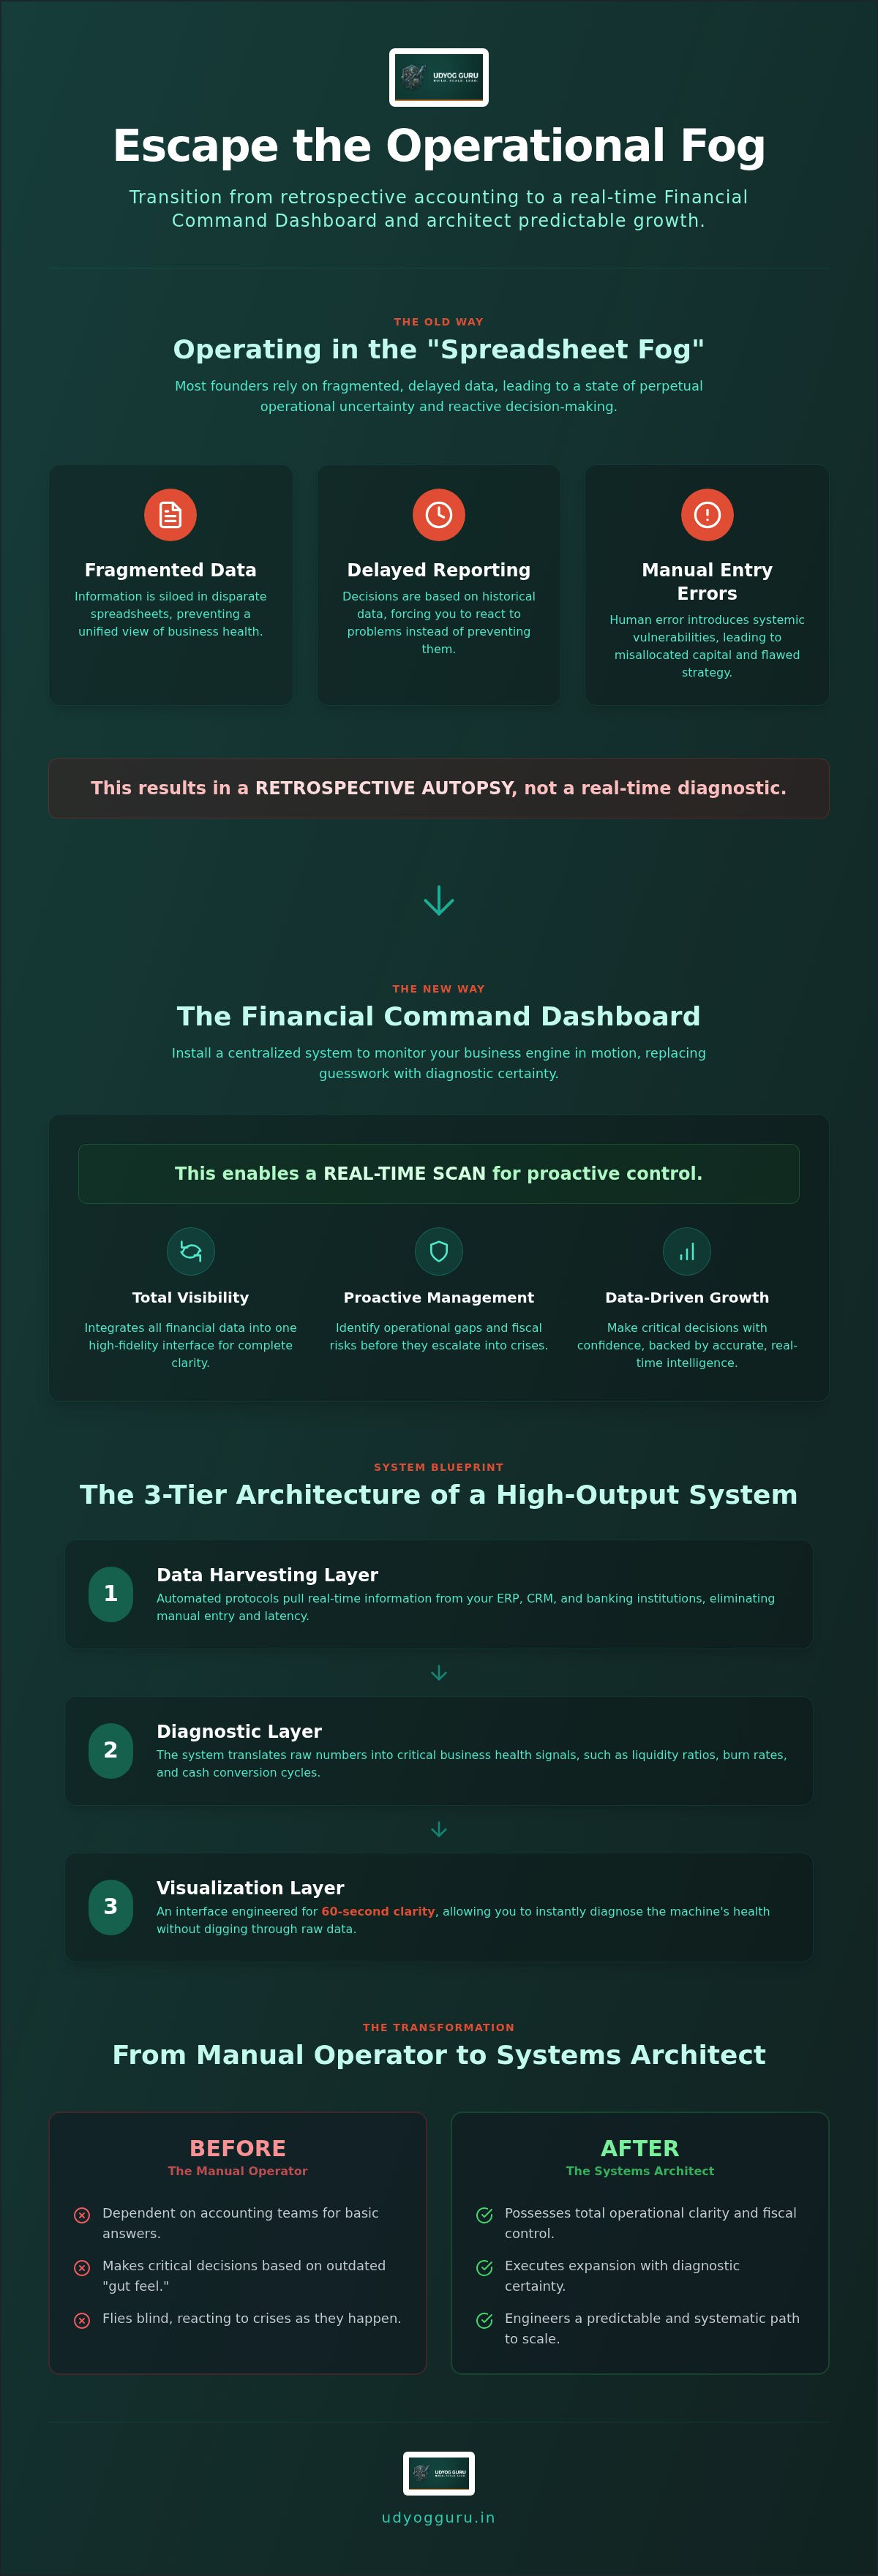
What if the primary cause of your operational friction isn't a lack of capital, but a failure in your diagnostic architecture? Most founders operate in a state of perpetual operational fog, relying on fragmented spreadsheets and delayed reports that provide a retrospective autopsy rather than a real-time scan. When you're forced to wait on accounting teams for basic answers, you're not leading; you're reacting to a machine you don't fully control. A robust financial dashboard for business owners is the necessary installation to transition from a manual operator to a Systems Architect.
You likely understand the frustration of discovering manual data entry errors only after a critical decision has been made. It's a systemic vulnerability that prevents predictable scaling. This guide will help you master the architecture of high-output financial systems to eliminate that fog and drive rigorous, data-driven growth. We'll examine the specific components of the Financial Command Dashboard, detailing how to integrate automated reporting and real-time cash flow visibility into your existing infrastructure. By the end of this analysis, you'll have the blueprint to install a command center that replaces founder dependency with total operational clarity and precise fiscal control.
Key Takeaways
- Learn how to transition from retrospective accounting autopsies to real-time diagnostic control using a financial dashboard for business owners.
- Understand the process of integrating your financial data with the Business X-Ray™ framework to identify and repair structural operational gaps.
- Master the hierarchy of financial metrics to prioritize vital signs over vanity data, ensuring your business machine maintains stability during rapid expansion.
- Follow a rigorous installation protocol to define North Star metrics and eliminate founder dependency on accounting teams for basic operational answers.
- Discover how your Financial Command Dashboard feeds the Business Acceleration Engine™ to engineer a predictable and systematic path toward scaling.
What is a Financial Command Dashboard for Business Owners?
A financial dashboard for business owners isn't a digital version of a monthly profit and loss statement. It's a centralized diagnostic system that integrates disparate financial data points into a single, high-fidelity interface. While traditional accounting acts as an autopsy, explaining why a business failed or succeeded in the previous quarter, a command dashboard functions as a live telemetry feed. It allows the founder to adjust the operational engine while the enterprise is in motion. You don't just look at what happened; you see what is happening.
This system focuses on every critical Key Performance Indicator (KPI) that dictates your structural integrity. Within our Business Diagnostic Scan protocol, the dashboard serves as the central nervous system. It provides the empirical data required to identify operational gaps before they manifest as fiscal crises. Founders must stop "checking the books" and start monitoring the engine. If you aren't looking at real-time data, you're flying blind.
The Architecture of Financial Transparency
Constructing a high-output dashboard requires a three-tier architecture designed for precision. First is the data harvesting layer, which uses automated protocols to pull real-time information from your ERP, CRM, and banking institutions. This eliminates the latency of manual entry. Next is the diagnostic layer; this is where the system translates raw numbers into business health signals, such as liquidity ratios or burn rates. Finally, the visualization layer is engineered for 60-second clarity. It's designed so a Systems Architect can scan the interface and immediately diagnose the health of the machine without digging through rows of raw data.
Eliminating the 'Spreadsheet Fog'
Scaling enterprises often suffocate under "spreadsheet fog." This occurs when manual data consolidation creates a fragmented view of reality, leading to a significant decision lag. Human error in manual entry isn't just a nuisance; it's a structural vulnerability that leads to missed opportunities and misallocated capital. Transitioning to a financial dashboard for business owners allows you to move from reactive firefighting to proactive system management. Instead of wondering if you have the cash flow to hire or expand, you'll have the diagnostic certainty to execute. You're no longer guessing; you're engineering. This shift removes the friction of manual reporting and replaces it with an automated engine for growth.
The Engineering of a High-Output Financial System
A business is not a living organism that grows by chance; it is a machine that requires precise calibration to operate at peak efficiency. When you install a financial dashboard for business owners, you're essentially attaching a diagnostic sensor to that machine. This "Business-as-Science" approach requires you to hypothesize potential growth levers, measure their impact through the dashboard, and calibrate your operations accordingly. If your data is erratic, your decisions will be too. High-output systems depend on structural integrity within your financial architecture. This means your chart of accounts must be standardized and your data pipelines must be automated to ensure accuracy.
To achieve total command, this dashboard must integrate seamlessly with our Business X-Ray™ framework. While the X-Ray identifies hidden flaws in your organizational tissue, the dashboard provides the live telemetry to monitor the repair. A scalable financial architecture requires a clear hierarchy of metrics that move beyond simple revenue tracking. You must build a system where raw data is automatically processed into actionable intelligence. This allows you to treat every business challenge as a solvable puzzle of logic and process.
Diagnosing Financial Bottlenecks
Financial leaks often hide in plain sight within the acquisition funnel. By tracking margins at every stage of the customer journey, you can identify exactly where capital is being wasted. High-resolution data allows you to focus on identifying operational bottlenecks in business that slow down your cash conversion cycle. For example, a widening gap in accounts receivable directly throttles growth velocity. If your dashboard shows an increase in Days Sales Outstanding (DSO), it's a signal that your billing engine is failing. You must address these mechanical failures before they compromise your ability to scale.
The Founder’s Command Protocols
Fiscal command requires a disciplined review cadence. You don't need to be the one entering data, but you must be the one interpreting the diagnosis. We advocate for the "15-Minute CEO Dashboard" philosophy. This protocol ensures you gain total clarity on your cash position and vital signs in minimal time. A structured cadence involves:
- Daily: Scan for anomalies in cash flow and unexpected expenses.
- Weekly: Review margin health and acquisition funnel efficiency.
- Monthly: Calibrate the overall scaling trajectory and structural overhead.
By delegating data entry while retaining diagnostic oversight, you maintain control without becoming a bottleneck yourself. If your current systems feel chaotic, a professional Business Diagnostic Scan can help identify where your architecture needs reinforcement. Total operational clarity is the result of rigorous system installation, not intuition.
Critical KPIs for the Modern Founder’s Command Center
A high-output financial dashboard for business owners must distinguish between vanity metrics and vital signs. While top-line revenue often serves as an ego-driven distraction, vital signs reveal the actual physiological health of the enterprise. We categorize these metrics into a rigid hierarchy: Survival, Stability, and Scaling. Survival metrics focus on immediate liquidity; Stability metrics analyze margin consistency; Scaling metrics measure the efficiency of capital deployment. By using specific business performance tracking metrics, founders can move from intuitive guesswork to empirical diagnosis. For Indian SMEs in 2026, this level of precision is mandatory to navigate shifting interest rates and evolving tax compliance frameworks.
The Profitability Dimensions
Profitability isn't a single number; it's a multi-dimensional analysis of how your engine converts effort into value. You must track the distinction between Gross Margin and Contribution Margin. While Gross Margin measures the direct costs of production, Contribution Margin reveals the profit generated after all variable costs, providing a clearer picture of how much each sale contributes to covering fixed overhead. Monitoring EBITDA serves as a critical proxy for business valuation, allowing you to view your company as an asset rather than just a job. High overhead efficiency ratios ensure you aren't carrying unnecessary organizational weight that throttles your growth velocity. If your administrative costs are rising without a proportional increase in output, your machine is losing calibration.
Liquidity and Cash Flow Velocity
Cash is the fuel of your business engine, and its velocity determines your scaling potential. The Cash Conversion Cycle (CCC) is the ultimate metric here; it measures the time elapsed between spending capital on resources and receiving cash from sales. A shorter CCC indicates a highly efficient machine that generates its own momentum. Your financial dashboard for business owners should prioritize predictive cash flow forecasting over historical bank balances. Relying on yesterday's balance is like driving while looking only in the rearview mirror. Monitoring your 'Runway' ensures that scaling a business remains a sustainable engineering project rather than a reckless gamble. Without this foresight, even a profitable business can face a liquidity-driven collapse during periods of rapid expansion.
Protocol for Installing a Financial Dashboard System
Installation of a financial dashboard for business owners is a rigorous engineering process rather than a simple software deployment. It requires a systematic approach to ensure that the data being scanned is both accurate and actionable. Without a structured protocol, a dashboard becomes a source of noise rather than a command center. To engineer a high-fidelity system, founders must follow a logical sequence of diagnosis and installation to ensure the resulting architecture supports predictable scaling.
- Step 1: Conduct a Financial X-Ray: Map every data source where capital enters or exits the machine, including bank accounts, ERP systems, and CRM pipelines.
- Step 2: Define North Star Metrics: Identify the singular indicators that dictate success for your current growth phase, such as Contribution Margin or Cash Conversion Cycle.
- Step 3: Establish Automated Data Pipelines: Hardened integrations must be built to eliminate manual data entry, ensuring the diagnostic feed remains objective and free from human error.
- Step 4: Design for High-Speed Scanning: The visual interface must prioritize vital signs, allowing a Systems Architect to diagnose the health of the enterprise within a 60-second window.
- Step 5: Audit and Calibrate: The system requires ongoing calibration against bank statements and tax filings to verify that the digital representation matches the ground truth.
AI and Automation Integration
Modern fiscal command relies on advanced automation to maintain accuracy. By leveraging AI Tech Business Integration protocols, founders can automate the categorization of complex transactions, significantly reducing manual accounting overhead. Intelligent systems don't just record data; they scan for anomalies and fiscal irregularities automatically, acting as an early-warning system for potential leaks. This level of automation ensures that your Financial Command Dashboard provides a real-time diagnostic scan of your business health without requiring constant manual intervention from your team.
Systematic Technology Stack Selection
Choosing the right tools is a critical component of technology integration for business owners. You must prioritize interoperability to ensure your financial dashboard for business owners communicates seamlessly with your existing CRM and ERP infrastructure. Cloud-based protocols are preferred for their real-time accessibility and security, but they must be configured to meet national compliance standards. Siloed data is the enemy of clarity; your technology stack must function as a unified engine to drive sustainable growth. To begin this installation and identify your structural gaps, you should first schedule a Business X-Ray™ diagnostic session.
Scaling with Clarity: The Business Acceleration Engine™
The installation of a financial dashboard for business owners is the essential precursor to activating the Business Acceleration Engine™. While earlier stages of the diagnostic protocol focus on identifying gaps and establishing stability, this phase transitions the enterprise into a high-velocity scaling mode. Scaling isn't merely a result of increased activity; it's the systematic expansion of a validated and calibrated operational model. By feeding real-time financial telemetry into the Business Acceleration Engine™, you move from founder-led growth, which is inherently limited by your personal bandwidth, to system-driven scaling. This shift is critical for founders who intend to build an asset that attracts external capital or operates profitably without their constant intervention.
Engineering Predictable Growth
Predictable growth requires the ability to model future scenarios based on rigorous historical data rather than optimistic projections. You don't guess how much a new hire or a marketing campaign will return; you audit your previous performance cycles through the dashboard to project future output. Capital allocation becomes a quantitative exercise. A well-calibrated financial dashboard for business owners allows you to see the direct relationship between workforce optimization and financial output. If your personnel costs are rising but your contribution margin per employee remains stagnant, your scaling engine has a structural flaw. You must use these metrics to identify the exact moment when the machine is ready for a capital injection to accelerate its trajectory.
The Path to Operational Excellence
Operational excellence is achieved when you close the loop between financial insight and operational execution. The Financial Command Dashboard must serve as the 'Single Source of Truth' for the entire organization. When every department head views the same diagnostic data, the friction caused by internal misalignment vanishes. This transparency is what allows a business to function without founder dependency. You're no longer the one making every micro-decision; you're the Systems Architect who has designed a machine capable of making its own adjustments based on the data it receives.
The final objective of this architecture is to create a business that is both scalable and sellable. Investors don't buy into operational chaos; they buy into predictable engines. By maintaining total fiscal command, you provide the empirical proof of stability and growth potential that lenders and acquirers require. It's time to stop acting as the manual operator of your business and start engineering its future. Secure your growth and install your Financial Command Dashboard today to begin the transition toward total operational clarity and system-driven success.
Architecting Permanent Fiscal Clarity
Operational fog is a symptom of fragmented data and manual dependency. To engineer a scalable enterprise, you must transition from a retrospective observer to a Systems Architect. By installing a financial dashboard for business owners, you establish a real-time telemetry feed that monitors the structural health of your machine. This transition allows you to move beyond vanity metrics and focus on the vital signs that drive predictable growth. You've learned how to map data sources through a rigorous installation protocol and how to leverage automated reporting to eliminate human error.
Success in 2026 requires more than intuition; it demands a calibrated engine. Our proprietary Business X-Ray™ diagnostic protocol identifies the hidden gaps in your organization, while the Business Acceleration Engine™ framework provides the power to scale. With specialized AI Tech Integration for SMEs, your financial reporting becomes a hands-off, high-fidelity command center. It's time to stop reacting to the past and start engineering your future. Install the Financial Command Dashboard in your business today and begin your journey toward total operational command. You have the blueprint; now it's time to build.
Frequently Asked Questions
What is the difference between a financial dashboard and an accounting report?
A financial dashboard provides real-time telemetry for decision-making, whereas an accounting report is a retrospective autopsy of past performance. While accounting reports satisfy regulatory compliance and tax requirements, they often arrive too late to influence operational outcomes. A financial dashboard for business owners integrates live data feeds to show current vital signs, allowing you to calibrate the business engine while it's in motion. It's the difference between looking at a map and using live GPS.
How often should a business owner review their financial dashboard?
You should follow a tiered review cadence to maintain total operational command without becoming a bottleneck. Perform a daily scan for cash flow anomalies and unexpected expenditures to ensure liquidity. Conduct a weekly analysis of margin health and acquisition funnel efficiency. Finally, execute a monthly audit of your overall scaling trajectory and structural overhead. This disciplined protocol ensures you spend no more than 15 minutes a day gaining total clarity on your organization's health.
Can I build a financial dashboard without custom software development?
You don't need custom software development to install a high-output command center. Udyog Guru focuses on systematic integration using existing technology stacks and AI protocols. Through our AI Tech Business Integration Bootcamp, founders learn to leverage automated data pipelines that connect their ERP, CRM, and banking systems. This approach emphasizes structural architecture over expensive custom coding, ensuring your dashboard is both scalable and maintainable without relying on external developers for every update.
What are the most important financial KPIs for an Indian SME?
Indian SMEs in 2026 must prioritize liquidity and profitability metrics to navigate a complex fiscal landscape. The Cash Conversion Cycle (CCC) is the most critical indicator of scaling velocity, as it measures how quickly capital returns to the business. You must also monitor Contribution Margin to understand the true profitability of individual units and EBITDA to track the overall valuation of the enterprise. These vital signs provide the empirical data needed for rigorous growth.
How does AI integration improve financial reporting accuracy?
AI integration improves accuracy by eliminating the manual data entry errors that often plague scaling enterprises. By utilizing intelligent categorization protocols, AI systems can automatically sort transactions and identify fiscal irregularities that human eyes might overlook. This automation ensures your financial dashboard for business owners remains a Single Source of Truth. It transforms raw data into a high-fidelity diagnostic feed, allowing you to make decisions based on precise, uncorrupted information.
Is it possible to automate cash flow forecasting for a scaling business?
Automation of cash flow forecasting is entirely possible through the integration of historical performance data and real-time sales pipelines. By connecting your CRM and accounting software, the Financial Command Dashboard can model future liquidity scenarios based on your current Cash Conversion Cycle. This predictive modeling replaces optimistic guesswork with quantitative analysis, ensuring you always know your runway before committing to major capital expenditures or scaling the Business Acceleration Engine™.
How do I ensure my financial data remains secure in a cloud-based dashboard?
Security is maintained through the use of encrypted data harvesting layers and standardized cloud security protocols. You must ensure your technology stack utilizes multi-factor authentication and follows national data protection standards. A cloud-based financial dashboard for business owners offers superior accessibility and real-time updates compared to local storage, provided you establish rigorous access controls. Secure interoperability between your systems is a core component of our systematic technology integration framework for modern founders.
What should I do if my dashboard identifies a significant operational bottleneck?
You should immediately initiate a Business X-Ray™ to diagnose the structural root cause of the failure. A dashboard identifies the symptom, such as a drop in margin or a rising accounts receivable gap, but the X-Ray identifies the underlying operational flaw. Once the bottleneck is isolated, you can use the Business Acceleration Engine™ to recalibrate the system and restore growth velocity. Treating symptoms without a proper diagnosis leads to recurring operational friction.


