

Most founders treat reporting as a post-mortem ritual rather than a live diagnostic protocol. If you're still manually extracting data into fragmented spreadsheets, your operation lacks the structural integrity required for scale; it's time to install automated business reporting systems. You've likely felt the friction of operational chaos where department data doesn't align, leaving you to manage by intuition rather than evidence. This manual reporting cycle isn't just inefficient; it's a primary driver of founder burnout in 2026. Even as the business process automation market reaches $18.83 billion this year, many leaders remain trapped in the manual labor of data reconciliation.
This article provides the blueprint to transition from fragmented data extraction to a systematic command center that delivers real-time operational clarity. We'll examine how to engineer a Financial Command Dashboard and calibrate your business machine for predictable, data-driven growth. By the end, you'll understand how to replace manual labor with automated accountability, ensuring every component of your workforce operates with total transparency. It's time to move beyond the guesswork and install a rigorous architecture for business health.
Key Takeaways
- Learn how to transition from manual data collection to a systematic protocol that converts raw information into actionable operational intelligence.
- Apply the Business X-Ray™ methodology to perform a rigorous diagnostic scan of your current workflows and eliminate critical visibility gaps.
- Master the three-layer architecture of automated business reporting systems to centralize your KPIs into a single, high-fidelity visualization interface.
- Discover how to map information flow across departments and install these reporting engines without the requirement for custom software development.
- Achieve total fiscal control by implementing a Financial Command Dashboard to monitor profitability, cash flow, and runway in real-time throughout 2026.
The Architecture of Automated Business Reporting Systems
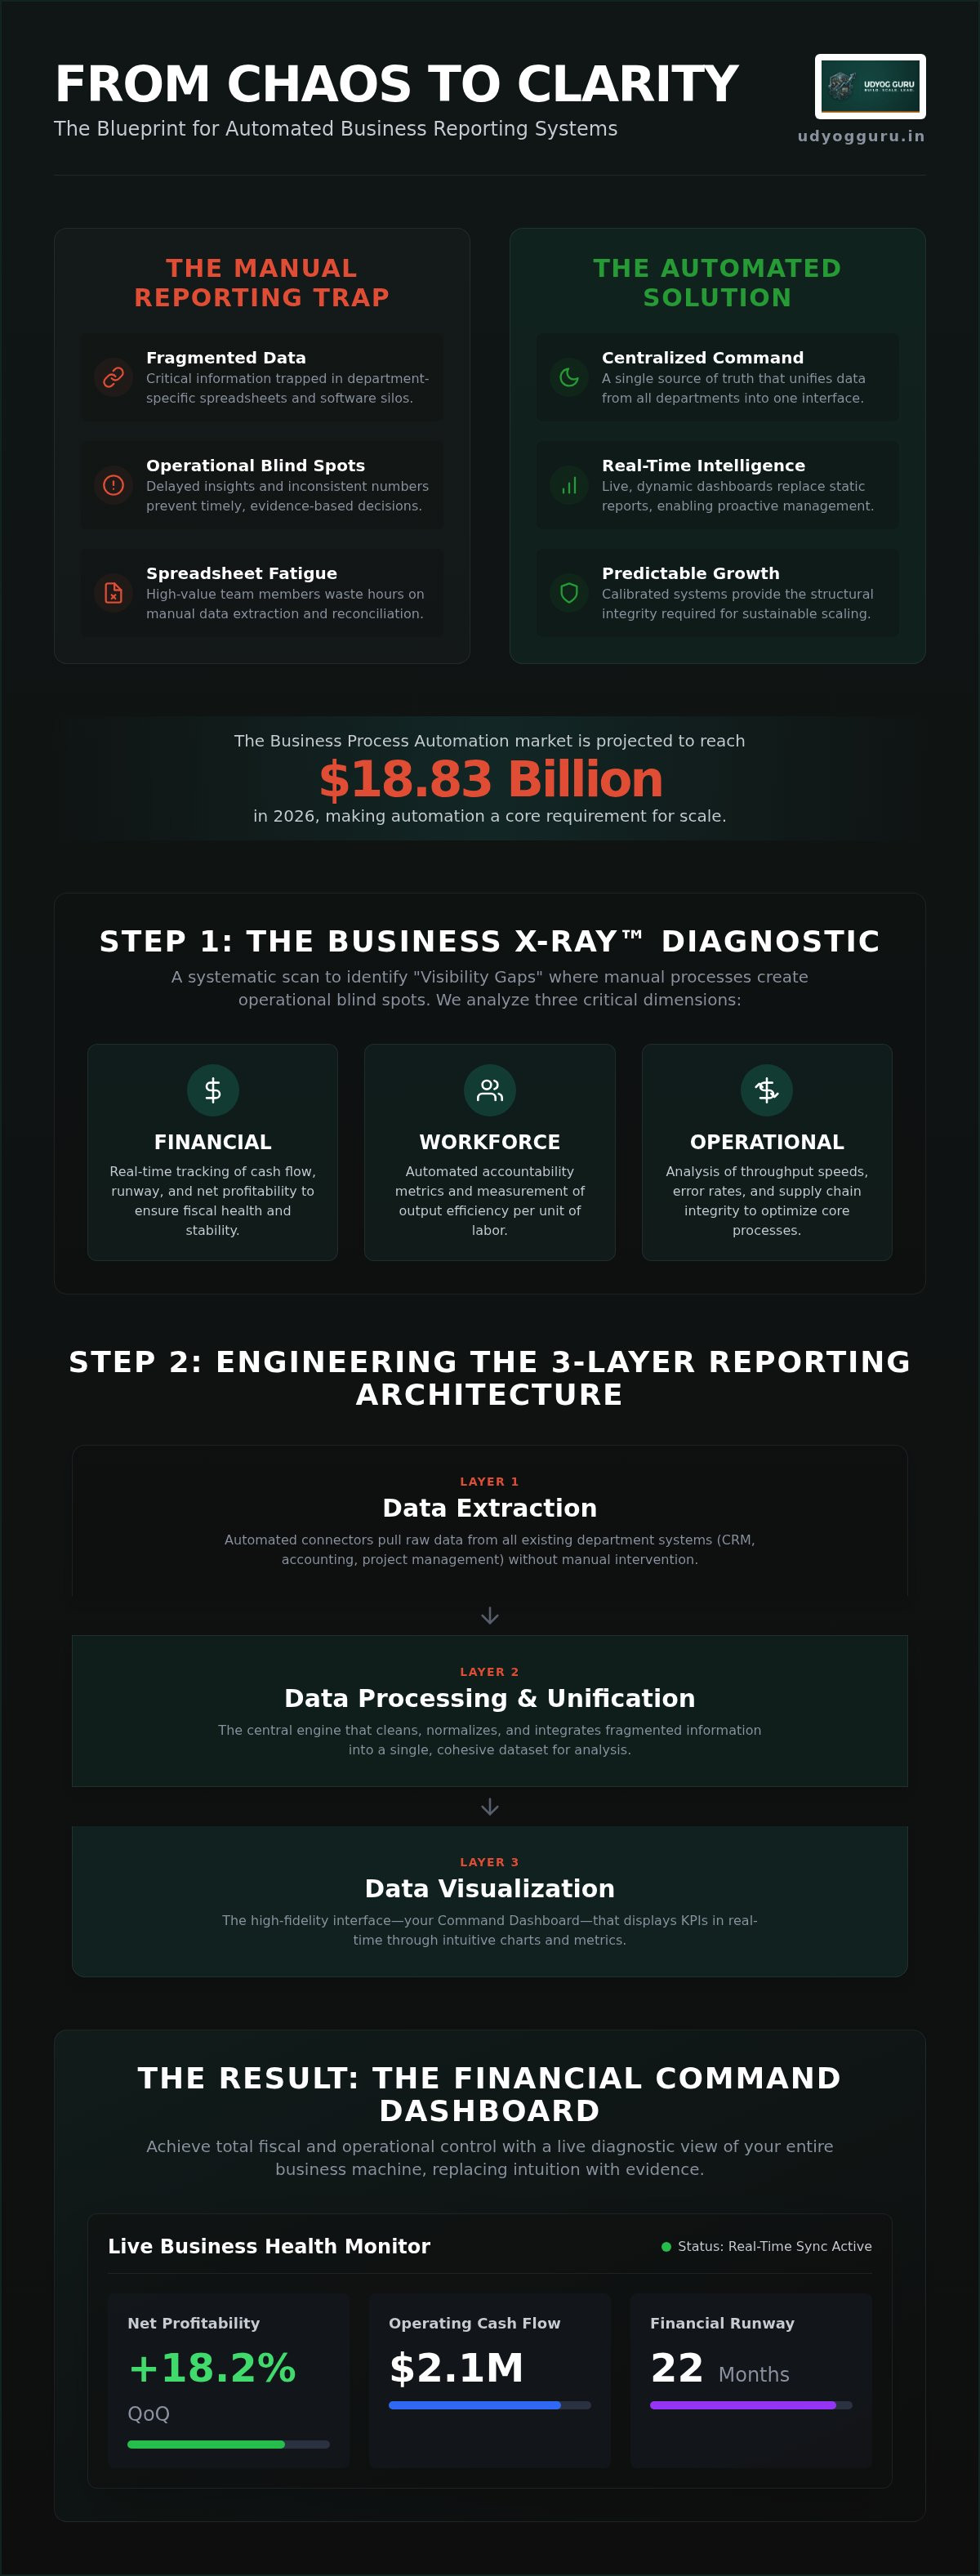
An automated business reporting system is a systematic protocol that extracts, processes, and visualizes key performance indicators without human intervention. In the 2026 landscape, where the business process automation market is projected to reach $18.83 billion, the shift from passive data collection to active operational intelligence is no longer optional. Manual reporting is a mechanical failure in any scaling business architecture. When founders rely on manual data extraction, they introduce human error into the core of the business engine, which leads to a loss of structural integrity and increased decision-making latency. Transitioning to automated business reporting systems ensures that the business operates as a calibrated machine rather than a collection of reactive tasks.
From Fragmented Data to Centralized Command
Maturing SMEs often suffer from information silos, where critical data is trapped in department-specific software. This fragmentation prevents a holistic view of the enterprise health. Automated reporting acts as the nervous system of the organization, transmitting real-time signals from every operational node to a centralized command center. By integrating various forms of Business intelligence software, founders can eliminate the "Information Silo" problem entirely. This structural change reduces the time between a problem occurring and its diagnostic detection. It removes the need for founder-led firefighting, allowing the leadership to focus on high-level architecture instead of data reconciliation. High-fidelity visibility is the primary requirement for reducing operational chaos.
The 2026 Reporting Standard for Founders
The standard for reporting has evolved beyond static monthly PDFs that only offer historical post-mortems. In 2026, founders require dynamic, interactive dashboards that refresh autonomously to provide a live diagnostic scan of the business. This approach prioritizes systems over motivation; sustainable growth is built on calibrated engines, not the temporary energy of the workforce. We focus on installing these protocols using existing, high-performance tools rather than building from scratch. Please note that while we engineer these visibility frameworks, we don't provide custom software development. Our methodology involves the precise calibration of the tools you already use to ensure they function as a unified reporting engine. An automated reporting system is a diagnostic tool for structural integrity. By installing automated business reporting systems, you replace intuition with evidence, creating a foundation for predictable and autonomous growth.
Diagnostic Protocol: Identifying Gaps in Your Reporting Machine
Before installing automated business reporting systems, a founder must perform a rigorous examination of the current infrastructure. We utilize the Business X-Ray™ methodology to conduct this diagnostic scan. This protocol isn't a mere survey; it's a structural analysis designed to identify "Visibility Gaps" where manual data handling creates operational blind spots. These gaps often manifest as inconsistent numbers between departments or delayed insights that prevent timely intervention. Pinpointing these failures is the first step in identifying operational bottlenecks in business that restrict your ability to scale.
We categorize the reporting architecture into three critical dimensions to ensure comprehensive coverage:
- Financial: Real-time tracking of cash flow, runway, and net profitability.
- Workforce: Automated accountability metrics and output efficiency per unit of labor.
- Operational: Throughput speeds, error rates, and supply chain integrity.
Scanning for Manual Extraction Failures
The most common mechanical failure in maturing SMEs is "Spreadsheet Fatigue." This occurs when high-value team members spend excessive hours in manual data extraction and reconciliation. It's a low-leverage activity that introduces significant risk. If your reporting relies on a staff member copying data from one platform to another, your data source is unreliable. In 2026, the time-loss associated with manual generation is a liability that compounds as you grow. A diagnostic scan often reveals that founders lose 10 to 15 hours per week simply waiting for or verifying reports that should be instantaneous.
Defining the Financial Command Architecture
Sustainable fiscal control requires a hierarchy of reporting that prioritizes strategic outcomes over vanity metrics. Strategic reports focus on long-term health, tactical reports track monthly goals, and operational reports monitor daily throughput. Most businesses fail because they don't have this tiered structure, which leads to a "fog of war" in decision-making. Installing a Financial Command Dashboard provides the high-level oversight needed to navigate complex market conditions with precision. To begin your own diagnostic journey, you can initiate a Business X-Ray™ assessment to pinpoint exactly where your reporting machine is leaking efficiency.
Engineering the Command Center: Core Components of Reporting Systems
Building a high-fidelity command center requires a departure from ad-hoc data gathering toward a rigid three-layer architecture. The structural integrity of automated business reporting systems depends on the seamless interaction between the Data Integration layer, the Processing Engine, and the Visualization Interface. While manual reporting is characterized by high decision-making latency and significant human error, automated systems provide a mechanical efficiency that allows for instantaneous business calibration. In 2026, where 98% of accounting professionals globally utilize AI-driven tools, failing to automate these components creates a competitive deficit that no amount of manual effort can bridge.
A high-output reporting system must include specific technical features to remain relevant:
- Real-time synchronization: Eliminating the time gap between a transaction and its visibility.
- AI-driven anomaly detection: Scanning for structural irregularities that deviate from historical norms.
- Automated alerts: Instant notifications when KPIs fall outside of calibrated safety ranges.
Data Integration and Synchronization Protocols
The first layer of the architecture focuses on connecting disparate tools such as your CRM, accounting software, and workforce management platforms via secure APIs. This stage requires a strict adherence to the "Garbage In, Garbage Out" diagnostic rule; if the source data is compromised, the resulting intelligence is worthless. We ensure data hygiene by automating the flow of information directly from systems like the Workforce Acceleration Engine™. This removes the human element from the synchronization protocol, ensuring that the data reaching your command center is both accurate and untampered.
Visualization and Actionable Dashboards
A dashboard's value is measured by its clarity rather than its complexity. The goal is the "15-Minute CEO Dashboard," a single interface that allows a founder to gain total business clarity in a quarter of an hour. This interface should prioritize strategic levers over granular noise, presenting a high-level diagnostic of the business machine's health. For founders seeking to master this level of oversight, engineering a financial dashboard for business owners is the final step in achieving total fiscal command. By visualizing the data processed through your automated business reporting systems, you can make decisions based on structural evidence rather than emotional intuition.
Implementation Roadmap: Installing Systems Without Custom Coding
Installing automated business reporting systems requires a methodical, four-phase installation protocol designed to bypass the traditional requirement for custom software development. By utilizing existing high-performance tools, founders can achieve structural transparency without the technical debt of bespoke code. This roadmap focuses on calibrating your current infrastructure to function as a unified reporting engine. Each phase builds upon the previous one to ensure the resulting architecture is both stable and scalable.
- Phase 1: Diagnostic Scan. Perform a rigorous audit of your existing software stack and data points. This inventory identifies which platforms contain the raw information required for your command center.
- Phase 2: Information Mapping. Define the automated flow of information across departments. This phase ensures that data moves from sales to finance to operations without human intervention or manual data entry.
- Phase 3: AI Integration. Incorporate agentic AI protocols for predictive reporting. By 2026, 83% of growing small and midsize businesses have adopted AI to handle anomaly detection and trend forecasting.
- Phase 4: Calibration. Conduct team training to transition the organization toward data-driven accountability. This final step ensures the workforce understands how to interpret and act upon the live data streams.
The AI Tech Business Integration Approach
The acceleration of this roadmap is achieved through strategies utilized in our Tier 3 AI Tech Business Integration Bootcamp. Rather than building new software, we use low-code middleware to bridge disparate systems, creating a seamless data pipeline. This approach aligns with the ai implementation roadmap for smes, which prioritizes the rapid installation of systematic frameworks. By leveraging these existing integrations, you can reduce the time-to-visibility from months to weeks, ensuring your reporting machine is operational before the next fiscal cycle.
Establishing Automated Accountability
Effective automated business reporting systems do more than visualize data; they drive team performance through radical transparency. When the Workforce X-Ray™ data feeds directly into founder reports, it creates a culture of automated accountability. You can set up automated triggers that notify the relevant department head the moment a KPI deviates from its calibrated safety range. This removes the need for micro-management, as the system itself acts as the primary monitor of operational integrity. To begin the transition from manual oversight to systematic command, you can apply for a Business Acceleration Engine™ consultation to map your specific reporting requirements.
The Financial Command Dashboard: Achieving Total Fiscal Control
The Financial Command Dashboard represents the final calibration of your automated business reporting systems. While basic accounting provides a look into the past, this dashboard functions as a live diagnostic interface for the present and future. It consolidates fragmented data into a unified view of profitability, cash flow, and runway in real-time. By 2026, the global AI in accounting market has reached $10.87 billion, reflecting a massive industry-wide transition toward these automated protocols. Founders who fail to adopt this high-fidelity oversight remain trapped in a reactive state, unable to see the mechanical reality of their capital flow.
Moving from historical accounting to predictive financial engineering is a structural necessity for scaling. Instead of waiting for month-end reports that arrive weeks too late, founders use these engines to simulate the impact of hiring or expansion before the capital is deployed. Understanding how to track business profitability through this lens ensures that every growth initiative is backed by structural evidence rather than optimistic projections. This transition allows the leadership to move from "firefighting" cash flow issues to engineering long-term fiscal stability.
Quantifying Predictable Growth
Automated data allows for the precise quantification of scaling requirements. By identifying high-margin revenue drivers through granular, department-level reporting, you can allocate resources where they generate the highest return on investment. This level of detail reveals which components of the business engine are underperforming and which are ready for acceleration. The Financial Command Dashboard provides an objective view of business health by stripping away the emotional noise of daily operations and presenting the raw mechanical reality of the enterprise. This objectivity is the primary requirement for making high-stakes decisions with calm confidence.
Next Steps: Installing Your Business Engine
Informational awareness is only the first step; the objective is structural implementation. Transitioning from manual data extraction to automated business reporting systems requires a shift in how you view your business architecture. The Business Acceleration Engine™ leverages these reporting protocols to turn raw data into fuel for rapid, controlled scaling. It ensures that the systems you've installed are not just visible but fully integrated into the business machine's daily output. To move beyond the fog of manual reporting and install a rigorous architecture for growth, you can audit your business systems with Udyog Guru and begin the diagnostic process today.
Calibrating Your Enterprise for Autonomous Growth
Transitioning from manual data extraction to automated business reporting systems is a fundamental requirement for maintaining structural integrity as you scale. This article has detailed the necessity of a three-layer architecture and the implementation of a Financial Command Dashboard to achieve total fiscal control. By replacing founder intuition with real-time operational intelligence, you eliminate visibility gaps and install a nervous system that drives predictable, data-driven results. These protocols ensure that your business functions as a calibrated machine rather than a collection of reactive tasks.
Udyog Guru provides the diagnostic and implementation frameworks required for this transformation. Through our proprietary Business X-Ray™ Diagnostic and specialized AI Tech Business Integration Bootcamp, we help you engineer a Financial Command Dashboard tailored to your machine's unique requirements. It's time to move beyond the operational chaos of manual reporting and install the rigorous architecture your business deserves for 2026 and beyond. Architect Your Business Command Center with Udyog Guru.
Frequently Asked Questions
What is the primary benefit of an automated business reporting system?
The primary benefit is the elimination of decision-making latency through real-time operational clarity. By installing automated business reporting systems, founders transition from reactive post-mortems to proactive management. This systematic approach ensures that the business machine operates with high-fidelity transparency, allowing for the immediate detection of structural irregularities. It removes the reliance on fragmented spreadsheets, providing a centralized command center that facilitates predictable growth without the requirement for manual intervention from the leadership team.
Do I need custom software to automate my business reports in 2026?
No, custom software development is an unnecessary expenditure that often introduces technical debt. In 2026, the proliferation of low-code middleware and robust APIs allows for the integration of your existing tools into a unified reporting engine. Our AI Tech Business Integration Bootcamp focuses on calibrating your current software stack to perform advanced data synchronization. This methodology prioritizes structural efficiency and rapid installation over the lengthy and expensive cycles associated with bespoke coding projects.
How long does it take to implement a Financial Command Dashboard?
The implementation timeline is dependent on the complexity of your current data architecture, but our structured protocols are designed for rapid deployment. Utilizing the Tier 2 Business Acceleration Engine™ framework, we focus on identifying and mapping your core KPIs within weeks. This systematic approach ensures that the Financial Command Dashboard is calibrated and operational quickly, allowing founders to gain fiscal control and begin data-driven scaling without the delays typically found in traditional consulting engagements.
Can automated reporting help in reducing founder burnout?
Automated reporting is a critical intervention for reducing founder burnout by eliminating the manual labor of data reconciliation. When you remove the burden of "firefighting" inconsistent reports, you reclaim 10 to 15 hours of high-leverage time per week. This structural shift allows you to focus on high-level architecture rather than operational minutiae. By delegating the monitoring of business health to a calibrated machine, you achieve a sustainable pace of leadership and organizational growth.
What is the difference between a standard MIS and an automated reporting system?
A standard Management Information System (MIS) often relies on historical data and manual inputs, which leads to significant reporting lag. In contrast, automated business reporting systems function as a live diagnostic protocol, providing real-time visualization of KPIs. While an MIS tells you what happened last month, an automated system identifies what is happening now and predicts future scaling requirements. This shift from historical post-mortems to predictive engineering is essential for maintaining a competitive advantage.
How does AI integration improve business reporting accuracy?
AI integration improves accuracy by removing the human element from data extraction and processing protocols. In 2026, where 98% of accounting professionals utilize AI, these tools are essential for identifying anomalies that manual audits might overlook. By embedding AI into your reporting machine, you can detect structural deviations in real-time, ensuring that your data remains a reliable foundation for decision-making. This creates a high-fidelity feedback loop that continuously recalibrates your business for maximum efficiency.
Is automated reporting suitable for small and medium enterprises (SMEs)?
Automated reporting is highly suitable and arguably essential for SMEs aiming for scalable growth. Small and medium enterprises often lack the large administrative teams required for manual data management, making automation a cost-effective alternative. It provides the same level of operational transparency enjoyed by large corporations without the associated overhead. By installing these systems early, SMEs can build a robust foundation that supports autonomous expansion and ensures the business remains a well-oiled machine.
What happens if my current data is messy or unorganized?
Messy or unorganized data is a common symptom of operational chaos that we address through the Business X-Ray™ diagnostic framework. Before any system installation, we perform a rigorous scan to identify data hygiene issues and "Visibility Gaps." This diagnostic protocol ensures that the "Garbage In, Garbage Out" rule is mitigated by cleaning and restructuring your data workflows. Once the architecture is stabilized, we can proceed with the installation of the Financial Command Dashboard for total fiscal control.


