

Team performance isn't a motivational outcome; it's a diagnostic variable of your business architecture. Most scaling enterprises operate in a state of chronic operational opacity, where founder intuition serves as a fragile substitute for structural data. You likely recognize the fatigue of managing inconsistent output and the risk of being the sole engine driving your team's momentum. This reliance on personal oversight isn't a leadership style; it's a systemic vulnerability that prevents true scale. To transition from chaos to a predictable machine, you must install a rigorous team performance metrics framework that functions as the sensory system of your organization.
This guide provides the clinical methodology required to architect a data-driven oversight system that eliminates founder dependency. You'll learn how to treat performance as a solvable puzzle of logic and process rather than an emotional variable. We'll examine how systems like the Workforce Acceleration Engine™ allow for the precise calibration of human capital. By following this structural blueprint, you'll move beyond the 14% of leaders who struggle with ineffective reviews and instead build a scalable engine of predictable output. We'll walk through the diagnostic steps to identify bottlenecks and install the necessary protocols for real-time operational transparency.
Key Takeaways
- Replace subjective founder intuition with a clinical team performance metrics framework that functions as the sensory system for your scaling enterprise.
- Differentiate between predictive leading indicators and historical lagging indicators to build a tiered hierarchy of organizational and individual data.
- Deploy the Workforce X-Ray™ diagnostic protocol to identify underperformance and operational bottlenecks before they compromise your structural integrity.
- Execute a structured installation of data collection protocols that transition your management style from manual oversight to automated, real-time transparency.
- Leverage the AI Tech Business Integration Bootcamp methodology to automate the data pipeline from task completion to executive dashboard visualization.
Beyond Intuition: The Clinical Necessity of a Team Performance Metrics Framework
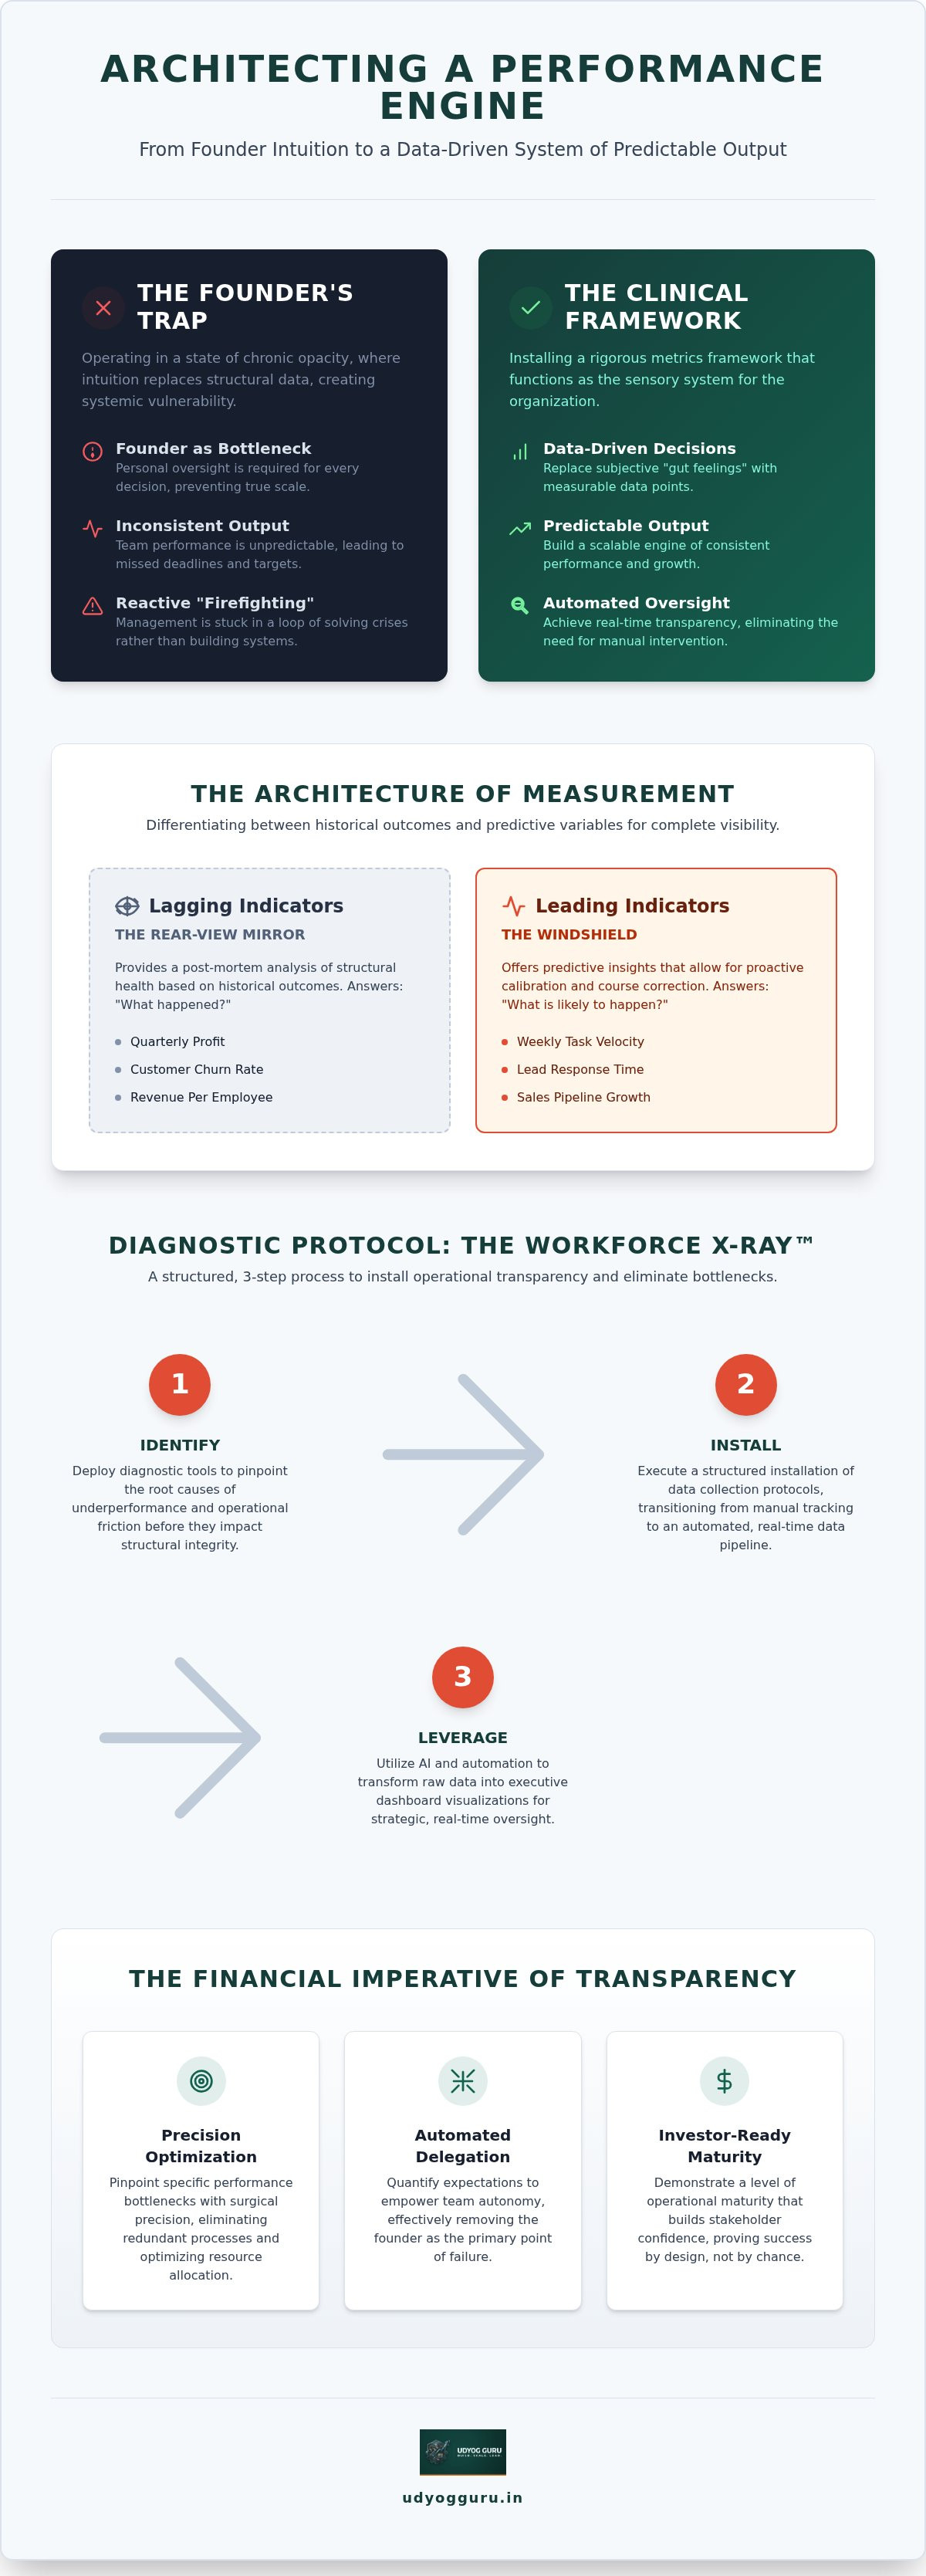
Scaling a business requires a fundamental shift in how leadership perceives and evaluates workforce activity. In the early stages, a founder's instinct is often sufficient to keep operations afloat, but this reliance on intuition becomes a systemic liability as headcount increases. A team performance metrics framework acts as the central nervous system of a scaling enterprise, converting abstract effort into measurable data points that inform strategic decisions. Without this structural foundation, management remains reactive rather than diagnostic, leading to inevitable structural collapse under the weight of increased complexity. A team performance metrics framework is a structured protocol for quantifying team-level output and efficiency. It moves the organization away from subjective "gut feelings" toward the rigorous discipline of performance measurement.
The Symptoms of a Metric-Less Organization
Organizations lacking a data-driven architecture often find themselves trapped in a "firefighting" loop. When workforce output is opaque, leaders cannot identify the root cause of delays or inconsistencies. This lack of clarity creates a severe bottleneck at the founder level. Every operational decision requires personal oversight because there's no system to validate performance autonomously. You might find yourself constantly intervening in low-level tasks just to ensure they're completed. The cost of this invisible inefficiency is high. It erodes profit margins and stalls growth because the business engine is fighting its own internal friction rather than accelerating toward market opportunities.
The ROI of Structural Transparency
Structural transparency isn't just a management preference; it's a financial imperative for any enterprise seeking to scale sustainably. When you install a robust framework, you gain the ability to pinpoint specific performance bottlenecks with surgical precision. This clarity directly impacts the bottom line by eliminating redundant processes and optimizing resource allocation across the workforce. Clear metrics provide the necessary baseline for automated delegation systems. By quantifying expectations and outcomes, you empower the team to operate with high levels of autonomy, effectively removing the founder as the primary point of failure. Finally, a business that operates on consistent data reporting is inherently more attractive to stakeholders. It demonstrates a level of operational maturity that builds investor-ready transparency, proving that the success of the enterprise is a result of intentional architecture rather than fortunate timing.
The Architecture of Measurement: Categorizing Quantitative and Qualitative Indicators
Effective measurement requires a tiered architecture that distinguishes between historical outcomes and predictive variables. Within a robust team performance metrics framework, data must be categorized into organizational, team, and individual layers to ensure granular visibility. Lagging indicators, such as quarterly profit or customer churn, provide a post-mortem analysis of structural health. Conversely, leading indicators, such as weekly task velocity or lead response times, offer predictive insights that allow for proactive calibration. This dual-focus approach ensures that the business surgeon isn't merely documenting a failure but preventing one. For a deeper understanding of these dynamics, an academic overview of team performance highlights the necessity of separating outcome-based results from the internal processes that generate them.
Output Metrics: Measuring the Result
Output metrics quantify the final product of the team's labor. Key indicators include revenue per employee and the specific profit contribution of individual departments. These figures reveal the economic efficiency of your human capital. Beyond finances, adherence to delivery protocols and project completion rates serve as critical markers of reliability. In a scaling enterprise, "Done" must be defined through the lens of standardized quality rather than subjective completion. If a deliverable requires significant rework, it hasn't met the protocol, regardless of the timeline. Monitoring these results through a Financial Command Dashboard provides the real-time visualization necessary to maintain operational control.
Efficiency Metrics: Measuring the Process
Efficiency metrics diagnose the health of the internal engine. Cycle time and throughput measure the speed of the business acceleration engine, identifying exactly where friction slows down the delivery pipeline. High output is unsustainable if it's achieved through excessive utilization rates that lead to workforce burnout. Optimal engine calibration requires balancing speed with systemic stability. Error rates and rework frequency are primary indicators of system failure; they suggest that the underlying protocols are either flawed or ignored. By tracking these variables, you can identify whether a bottleneck is a personnel issue or an architectural defect. This data-driven approach replaces frantic management with systematic repair, ensuring that every component of the workforce is operating at peak performance without compromising the integrity of the whole.
Diagnostic Precision: Implementing the Workforce X-Ray™ for Operational Excellence
The Workforce X-Ray™ is not a performance review; it's a diagnostic protocol designed to identify structural weaknesses within the human capital layer. While traditional HR focuses on sentiment, this system scans for "Silent Killers"—micro-inefficiencies and protocol deviations that compromise the bottom line long before they manifest as a deficit on a P&L statement. By integrating this protocol into your team performance metrics framework, you transform the management layer from a reactive unit into a diagnostic engine. This level of precision is required to map individual accountability directly to collective team targets, ensuring every gear in the machine turns in synchronization with organizational goals. Executing a workforce performance audit provides the evidentiary basis for these corrections, shifting the burden of proof from the founder's perception to the team's data.
The Anatomy of a Performance Audit
A rigorous audit follows a three-step installation logic to ensure no variable is overlooked. First, you must establish the baseline by aggregating historical data points from previous quarters. This creates a control group against which current output is measured. Second, the system identifies outliers in both output and behavioral adherence. These outliers aren't always underperformers; they can also be high-output individuals whose success is unrepeatable because it bypasses standard protocols. Third, the audit correlates team performance with broader workforce optimization strategies to determine if the team has the necessary resources to meet its targets. This diagnostic sequence ensures that performance issues are solved at the system level rather than the individual level.
Removing Founder Dependency through Data
The primary goal of a data-driven team performance metrics framework is the total elimination of the founder as a performance bottleneck. When metrics are transparent and real-time, the need for constant "check-ins" or manual supervision vanishes. The dashboard, rather than the founder, becomes the arbiter of truth. This shift fundamentally alters the role of leadership. You move from being a "Manager as Supervisor" to a "Manager as Systems Analyst," where your primary task is the calibration of the engine rather than the motivation of the crew. It's the difference between pushing a car and tuning its fuel injection system. By installing these diagnostic protocols, you ensure that accountability is an automated byproduct of the architecture itself.
Installing the Infrastructure: A Step-by-Step System for Data Integration
Installing a team performance metrics framework requires a sequential deployment strategy to ensure the resulting data is both accurate and actionable. This installation process follows a four-phase logic: diagnosis, architecture, installation, and calibration. In Phase 1, you must perform a business diagnostic scan to identify the critical KPIs that move the needle for your specific enterprise. Phase 2 involves the architecture of data collection protocols, defining exactly how and where data is captured. Phase 3 is the physical installation, where tracking mechanisms are embedded into the daily workflows of the team. Finally, Phase 4 focuses on calibration, where you refine these metrics based on real-world output to ensure the engine is tuned for maximum efficiency. This technical infrastructure serves as the bedrock for scalable growth, providing the transparency needed to manage by fact rather than feeling.
Selecting Your Critical "Vital Signs"
Effective oversight is often compromised by "Data Obesity," a condition where an organization tracks too many variables, leading to analytical paralysis. To maintain structural clarity, you should adopt the "Rule of 5," which dictates selecting no more than five core indicators that define the health of a specific team. These vital signs must align directly with the Financial Command Dashboard, ensuring that every micro-metric at the team level correlates with macro-financial outcomes. Tracking the wrong variables is as dangerous as tracking none at all; it creates a false sense of security while systemic rot persists in unmonitored areas. You don't need a thousand data points; you need the five that signal a pending engine failure.
Protocols for Data Integrity
The utility of any framework is entirely dependent on the integrity of the underlying data. Objective data collection is mandatory to remove the personal bias that often plagues manual reporting. This is achieved through the implementation of rigorous Standard Operating Procedures (SOPs) that govern how tasks are logged and measured. Clean data is a byproduct of clean processes. Real-time reporting protocols are essential because they allow for immediate corrective action before a minor deviation becomes a structural failure. By automating these collection points, you ensure that the performance data remains untainted by human error or subjective interpretation. If you're ready to stabilize your operations, you can install the Business Acceleration Engine™ to create a permanent culture of accountability.
Optimizing the Engine: Leveraging AI and Automation for Real-Time Oversight
A team performance metrics framework reaches its highest level of utility when it's integrated with automated intelligence. In a scaling enterprise, the speed of data acquisition determines the speed of corrective action. Manual reporting is a structural bottleneck that introduces human error and latency into the diagnostic process. By leveraging the AI Tech Business Integration Bootcamp, you can transform your performance tracking from a periodic audit into a real-time sensory system. This transition involves automating the data pipeline from the moment of task completion directly to your visualization layer. The result is a Workforce Acceleration Engine™ that doesn't just record history but uses predictive analytics to forecast performance bottlenecks before they manifest as operational delays. When your architecture is tech-integrated, your ability to scale isn't limited by your management bandwidth but by the efficiency of your algorithms.
Automation Protocols for Performance Monitoring
Replacing manual spreadsheets with automated API integrations is the first step toward data integrity. These protocols ensure that the information feeding your team performance metrics framework is objective and untainted by subjective interpretation. You should install "Trigger Alerts" that activate when specific metrics fall outside of pre-defined safe parameters, allowing for immediate surgical intervention. AI can also be deployed to summarize qualitative feedback through sentiment analysis, converting abstract employee communication into structured data points. This allows leadership to scan the internal health of the organization with the same precision used for financial forecasting. Automation removes the friction of data entry, ensuring that your diagnostic tools are always populated with fresh, accurate information.
The Final Installation: A Self-Correcting System
The ultimate goal of this architecture is the creation of a self-correcting feedback loop. When the team has access to real-time data, they begin to use these metrics to self-optimize, reducing the need for top-down management. The Financial Command Dashboard provides a 360-degree view of these operations, linking workforce output to fiscal health in a single pane of glass. This is the final stage of the transition from founder-led chaos to a state of predictable, scalable growth. Your business is no longer a collection of individuals working in silos; it's a finely tuned machine where every component is visible, measurable, and calibrated for peak efficiency. By installing these automated systems, you ensure that accountability is not a periodic event but a constant, structural reality of your business engine.
Architecting a Self-Correcting Engine of Growth
Transitioning from founder-led chaos to systemic clarity requires more than a change in mindset; it demands a fundamental rebuild of your operational architecture. By installing a robust team performance metrics framework, you convert your organization into a self-correcting engine where data, not intuition, dictates strategic calibration. You've seen how the proprietary Workforce X-Ray™ diagnostic tool identifies silent inefficiencies before they impact your bottom line. We've examined how expertise in AI Tech Business Integration allows for real-time oversight, effectively removing the founder as a performance bottleneck. This systems-first approach ensures that your scaling efforts are grounded in structural integrity rather than erratic energy.
The transition to a predictable, data-driven enterprise is a solvable puzzle of logic and process. You're now equipped with the blueprint to install automated tracking and predictive analytics within your daily workflows. To move beyond the limitations of manual supervision and embrace a state of operational transparency, you must take the first diagnostic step. Begin your Business X-Ray™ today to diagnose your operational gaps. You've the architectural plan in hand; it's time to begin the installation and secure your organization's future.
Frequently Asked Questions
What is the most critical metric in a team performance framework?
The most critical metric is the one that directly correlates workforce activity to the P&L, such as revenue per employee or project throughput velocity. In a robust team performance metrics framework, you must prioritize "Vital Signs" that signal systemic health rather than vanity data. These indicators allow for the precise calibration of the Business Acceleration Engine™. Focusing on the core five ensures structural clarity and prevents the analytical paralysis caused by data obesity.
How do I introduce a metrics framework without demotivating my team?
Introduce the framework as a diagnostic installation designed to enhance structural integrity rather than a tool for individual surveillance. Position the system as a means to eliminate operational opacity and provide the team with clear, objective protocols for success. When the workforce understands that the dashboard, not the founder's intuition, is the arbiter of truth, the shift from supervisor to systems analyst fosters a culture of high-output accountability.
Can a team performance framework work for remote or hybrid teams?
A data-driven framework is essential for remote and hybrid environments where physical oversight is impossible. The Financial Command Dashboard provides a 360-degree view of operations regardless of geographical distribution. By automating the data pipeline from task completion to visualization, you maintain real-time transparency across the organization. This clinical approach ensures that the Workforce Acceleration Engine™ remains optimized, providing a consistent sensory system that functions independently of physical office boundaries.
What is the difference between a KPI and a team performance metric?
A Key Performance Indicator (KPI) represents a macro-level outcome, while a team performance metric is a micro-level variable used for diagnostic calibration. For example, quarterly profit is a lagging KPI, whereas weekly task cycle time is a leading performance metric. You must understand this hierarchy to build an effective architecture. KPIs tell you if the machine is moving; metrics tell you which specific gear in the engine requires surgical repair or adjustment.
How often should a business owner review the team performance dashboard?
A business owner should scan the high-level vitals on the Financial Command Dashboard daily to detect immediate deviations from safe parameters. However, deep-dive calibration sessions should occur weekly to analyze trends and correlate team output with broader workforce optimization strategies. This rhythm ensures you remain a systems architect who monitors the engine's health without becoming a bottleneck. Consistent review allows for the proactive identification of silent killers before they impact the P&L.
What tools are required to implement a Workforce X-Ray™?
Implementing a Workforce X-Ray™ requires the proprietary diagnostic protocols developed by Udyog Guru to scan for micro-inefficiencies. You don't need custom software development; instead, you need a structured audit system that aggregates historical data and identifies outliers in output. This tool functions as a surgical instrument to map individual accountability to collective targets. The process is finalized by embedding tracking into daily workflows through standardized operating procedures that ensure data integrity.
How does AI improve the accuracy of performance tracking?
AI improves accuracy by eliminating human bias and automating the extraction of qualitative data through sentiment analysis. Within the AI Tech Business Integration Bootcamp, leaders learn to replace manual spreadsheets with automated API integrations. This technology allows for predictive analytics, forecasting potential bottlenecks before they manifest as structural failures. By removing the friction of manual entry, AI ensures that the team performance metrics framework remains populated with objective, real-time data for precise decision-making.
What happens if a team consistently fails to meet its metrics?
Consistent failure to meet metrics triggers a diagnostic repair protocol rather than a motivational intervention. You must determine if the underperformance is a result of personnel outliers or a fundamental architectural defect in the system. If the protocols are followed but the output remains low, the system requires recalibration. Using a workforce performance audit, you can pinpoint the specific bottleneck and apply a structural solution, ensuring the business engine returns to peak operational efficiency.


